Mission
To raise awareness of services available for people with disabilities seeking employment and encourage businesses, state and local governments to embrace their employment.
——————————————————————————————–
Enable the Disabled – Hire Them (www.ETDHT.com) Website Guide Tour
Unemployment Statistics
July 23rd, 2026
The website has been updated with June 2026 State Unemployment data
The look of the website has been revised. Also, the toggle button in the upper left corner switches the background from light to dark.
The Website Has Been Updated with Up for Election tags for all Governors and Senators that are up for election in 2026.
Remember, at the top of each State and Fun Fact page is a link to a page containing contact information for the Governor, Senators and House of Representatives.
The Bureau of Labor Statistics did not publish data for the October 2025 state and municipality unemployment data updates due to the federal government shutdown. No surveys were pulled which is the source of the data.
I will be forced to estimate missing data by taking the month prior to the missing data and the month after the missing data and divide it by 2.
National Unemployment Updates
National Unemployment as of June 2026
January 2026 estimates were revised to incorporate updated population controls. For more information, see www.bls.gov/cps/documentation.htm#pop.On June 3, 2026, seasonally adjusted data for non-modeled metropolitan areas and metropolitan divisions were updated from January 2016 forward based on revised historical not seasonally adjusted estimates, re-fitting of seasonal-adjustment models, and re-smoothing. |
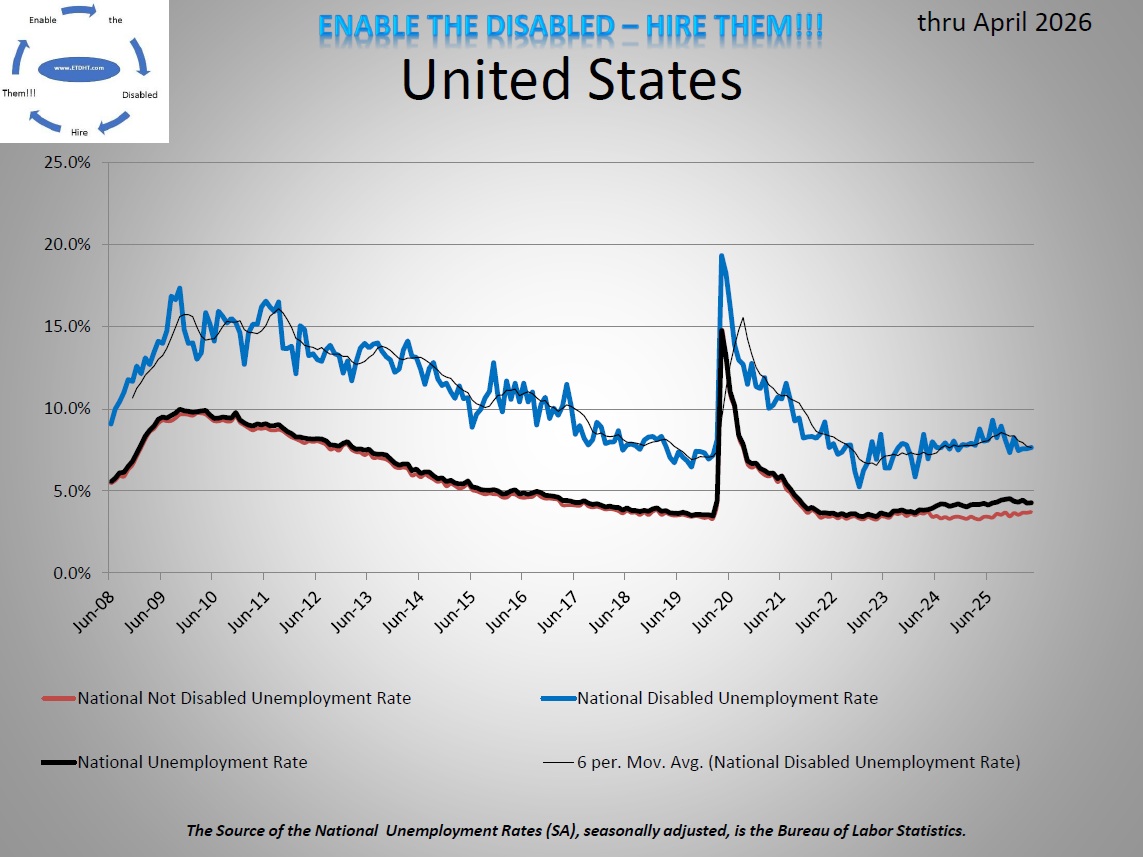
The June 2026 total unemployment rate (seasonally adjusted) decreased from the May 2026 total unemployment rate (4.3% to 4.2%). The unemployment rates (seasonally adjusted) remained the same for people with no disabilities (4.0%) but decreased for people with a disability (9.5% to 8.2%).
The June 2026 total unemployment rate (non-adjusted) increased from the May 2026 total unemployment rate (4.1% to 4.4%). The unemployment rate (non-adjusted) for people with no disabilities increased for people with no disabilities (3.8% to 4.2%) but decreased for people with a disability (9.1% to 8.6%).
Unemployment rates for disabled people are more than double the rate for non-disabled people 4.0% compared to 8.2% (seasonally adjusted) and 4.2% compared to 8.6% (non-seasonally adjusted).
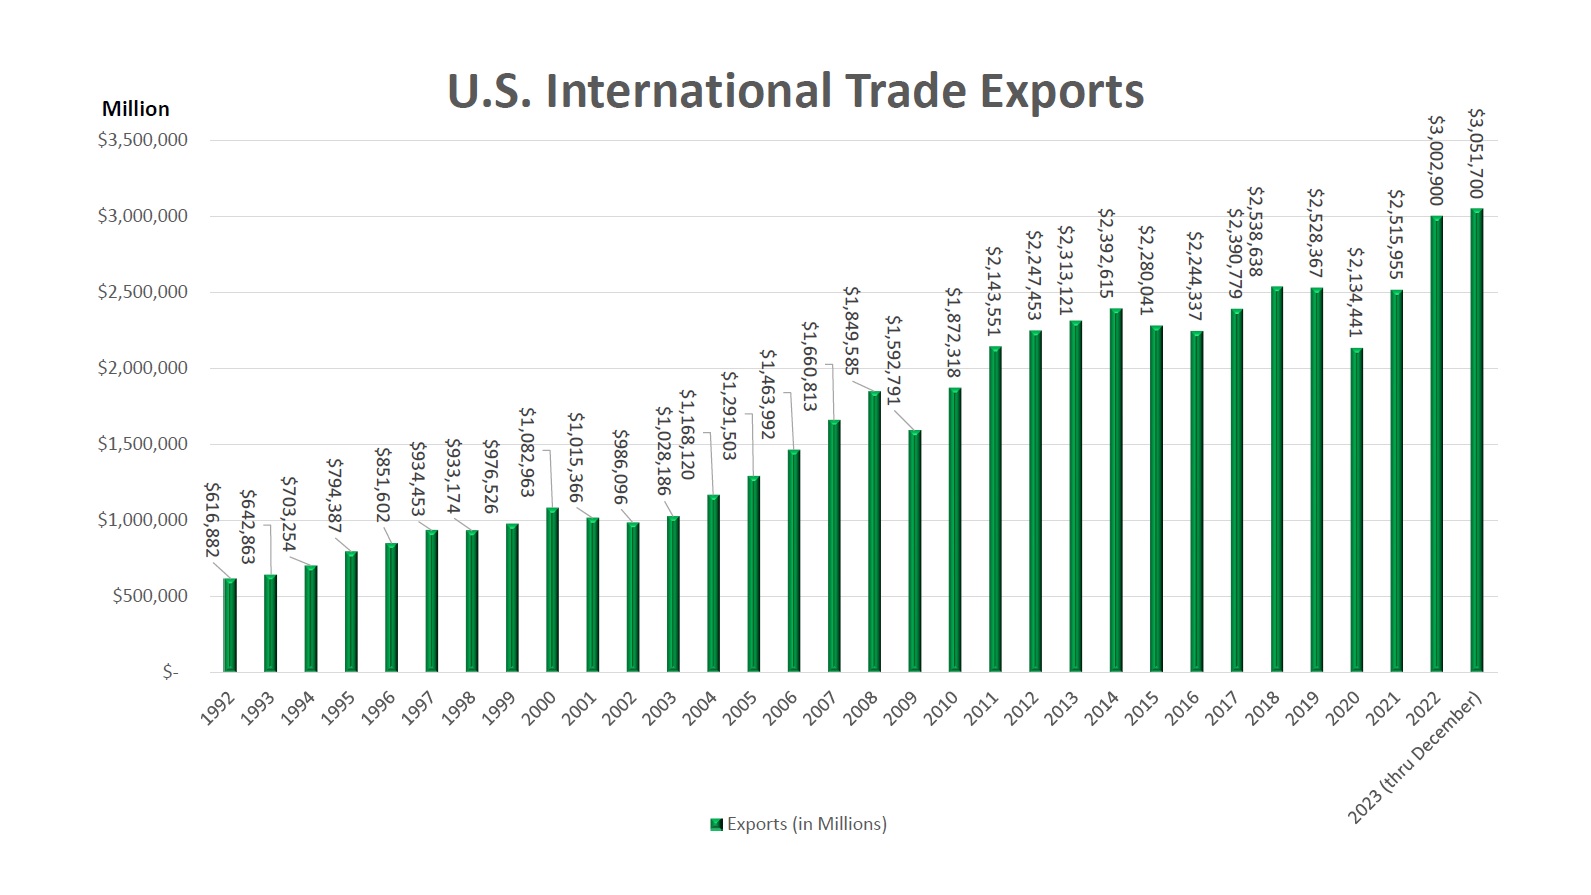
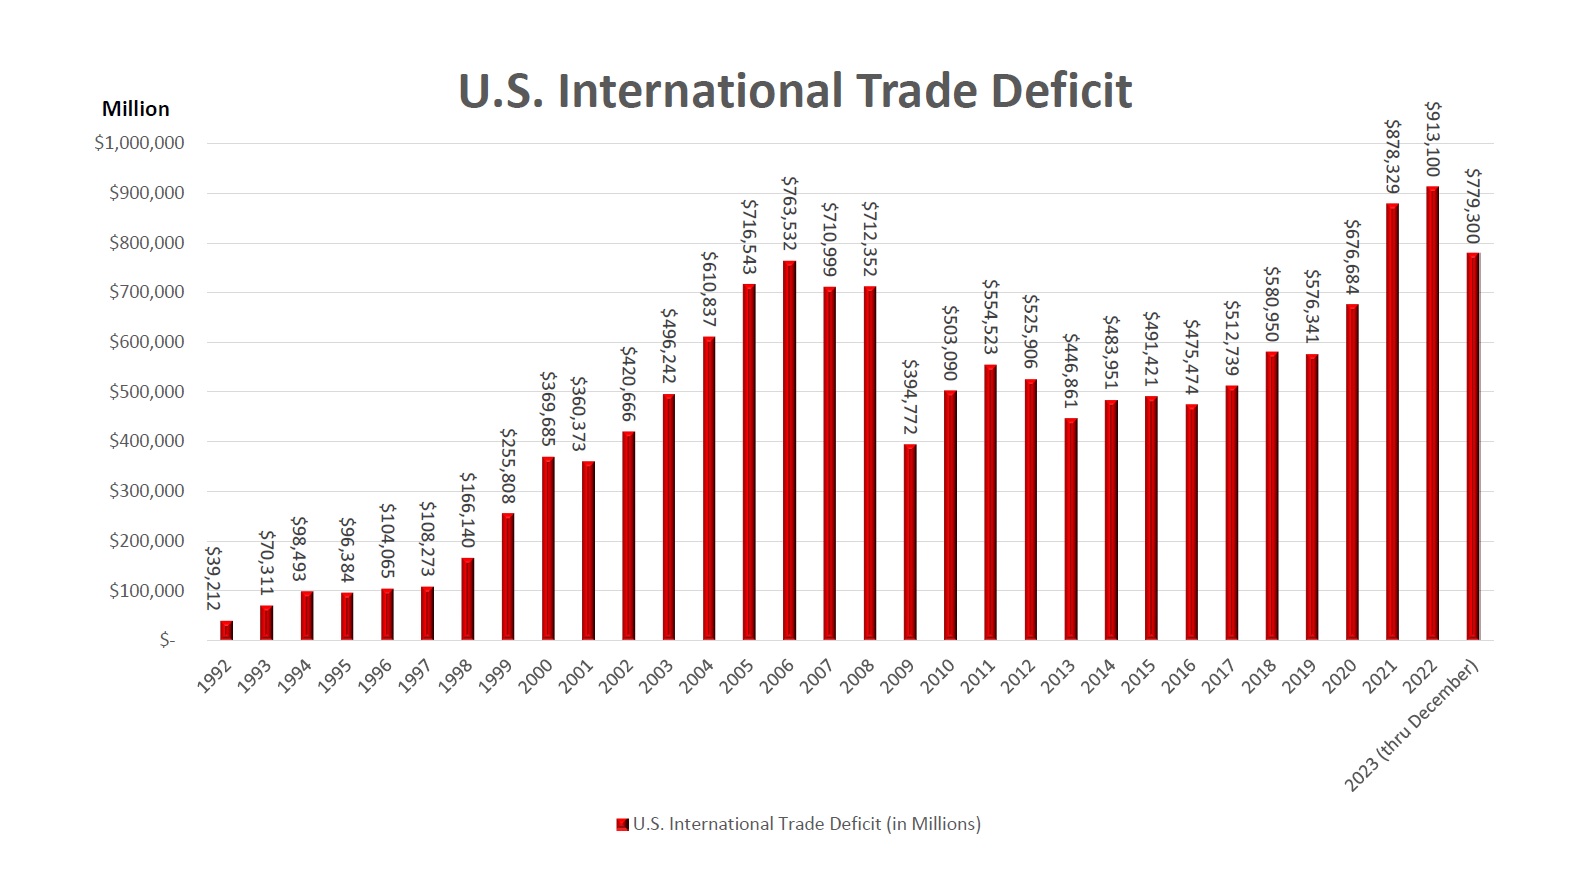
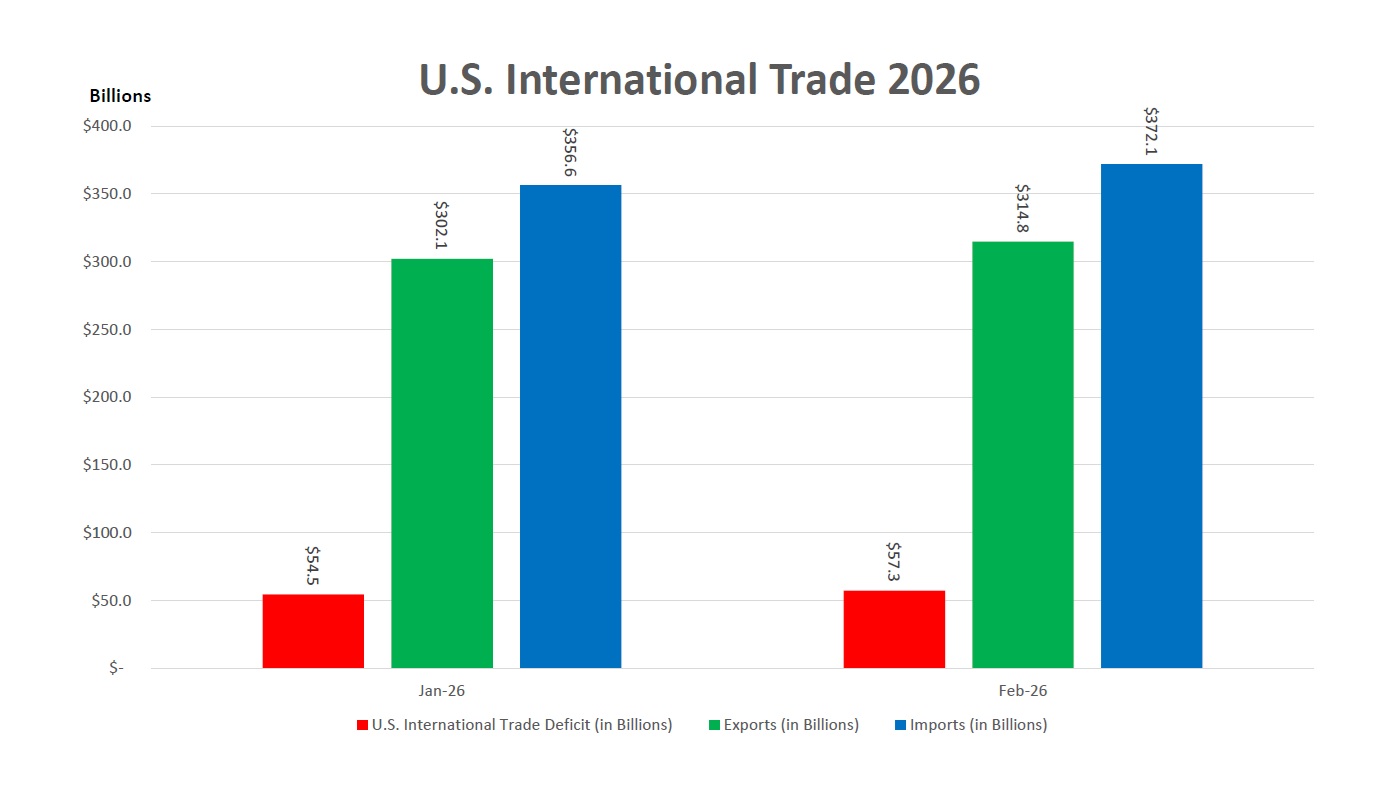
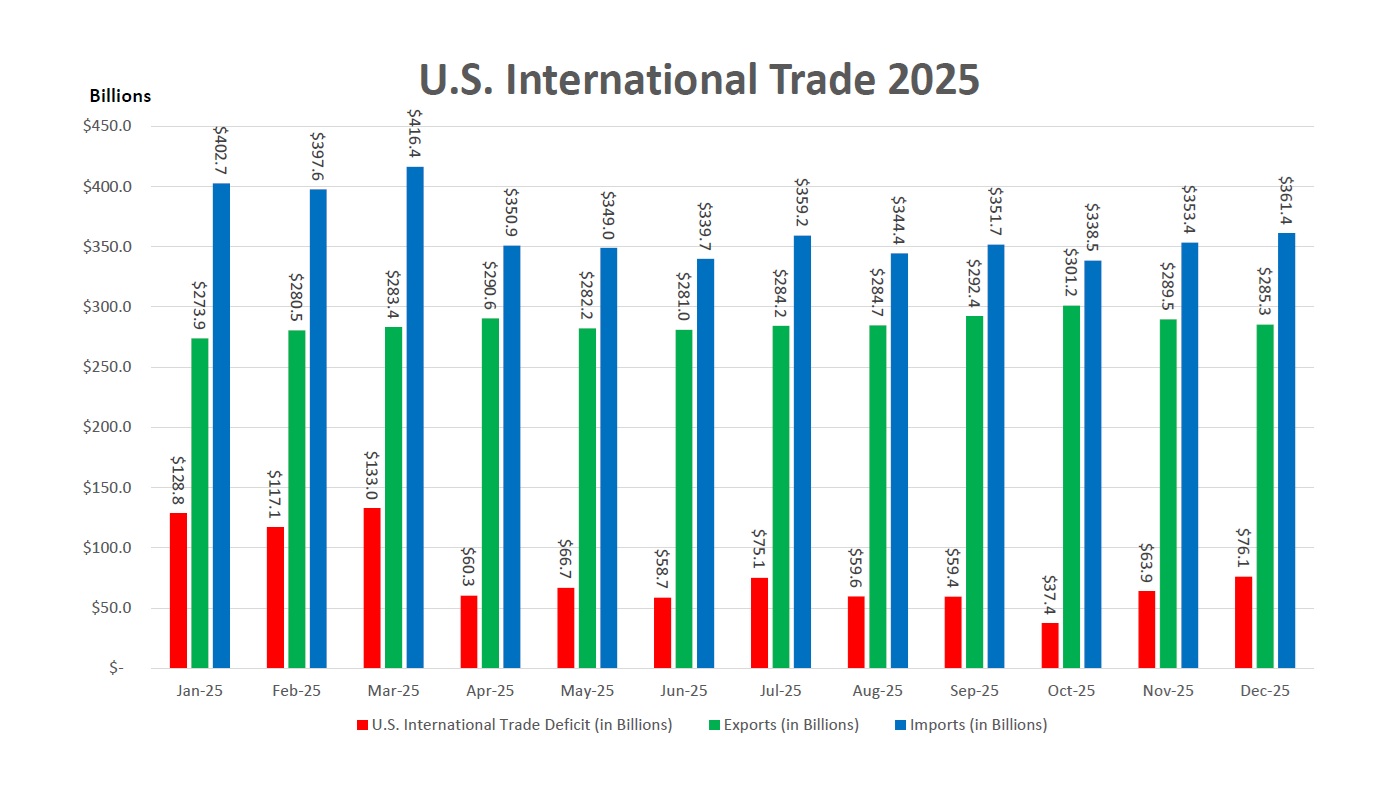
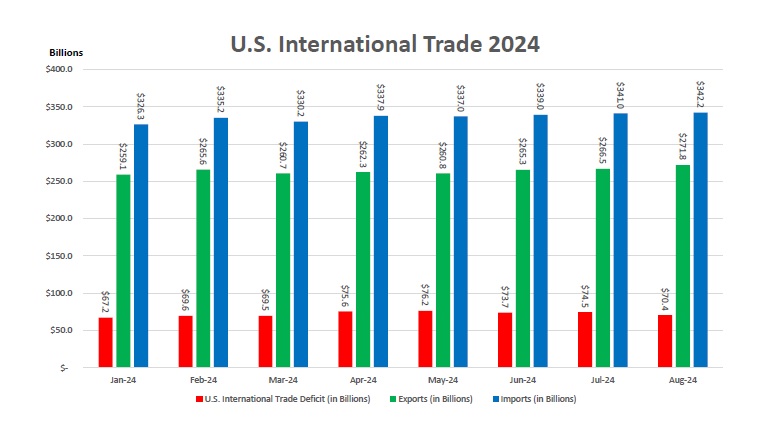
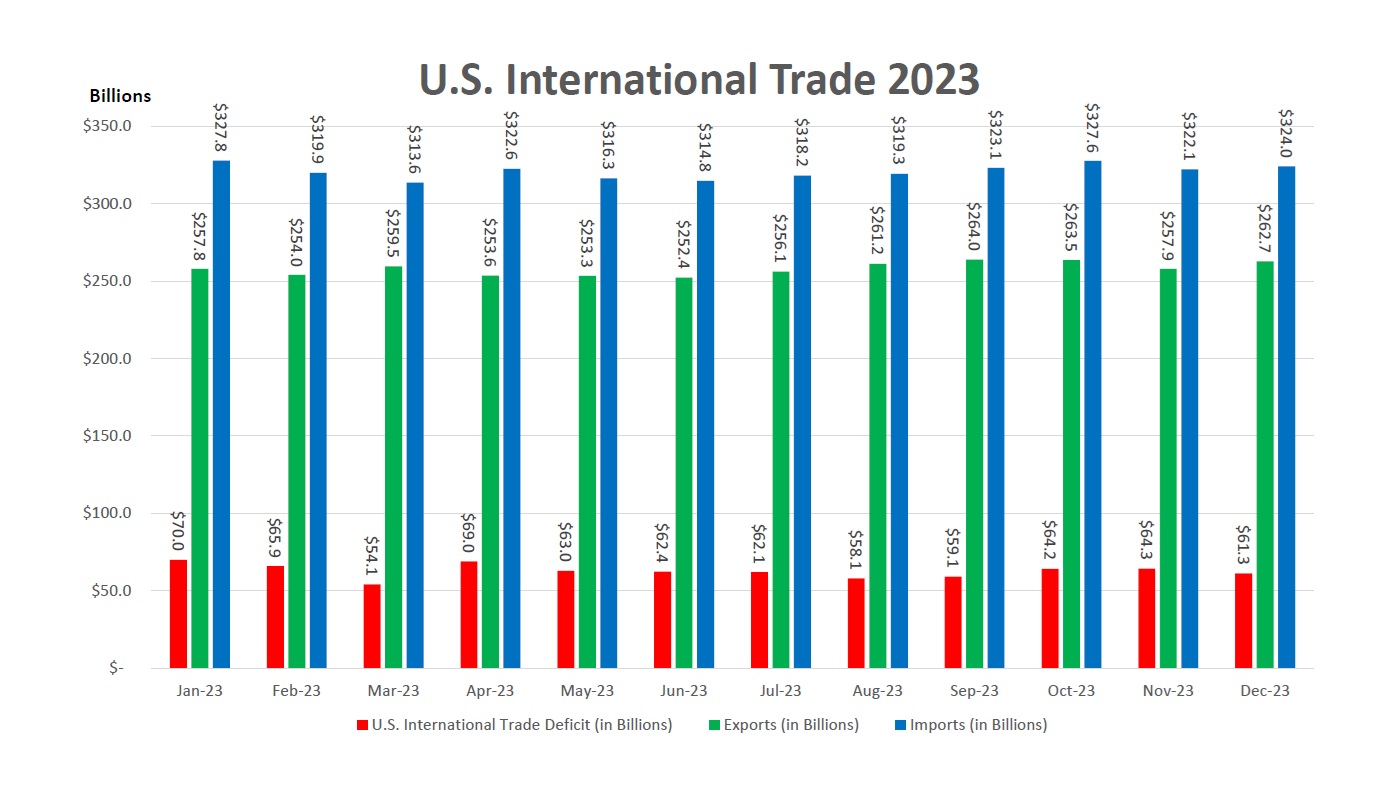
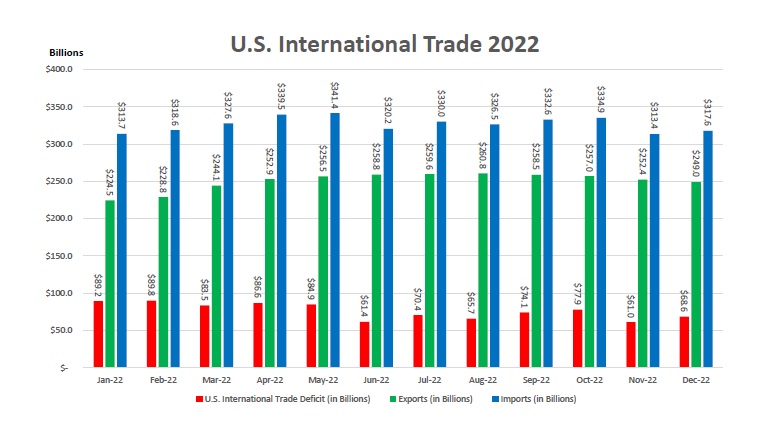
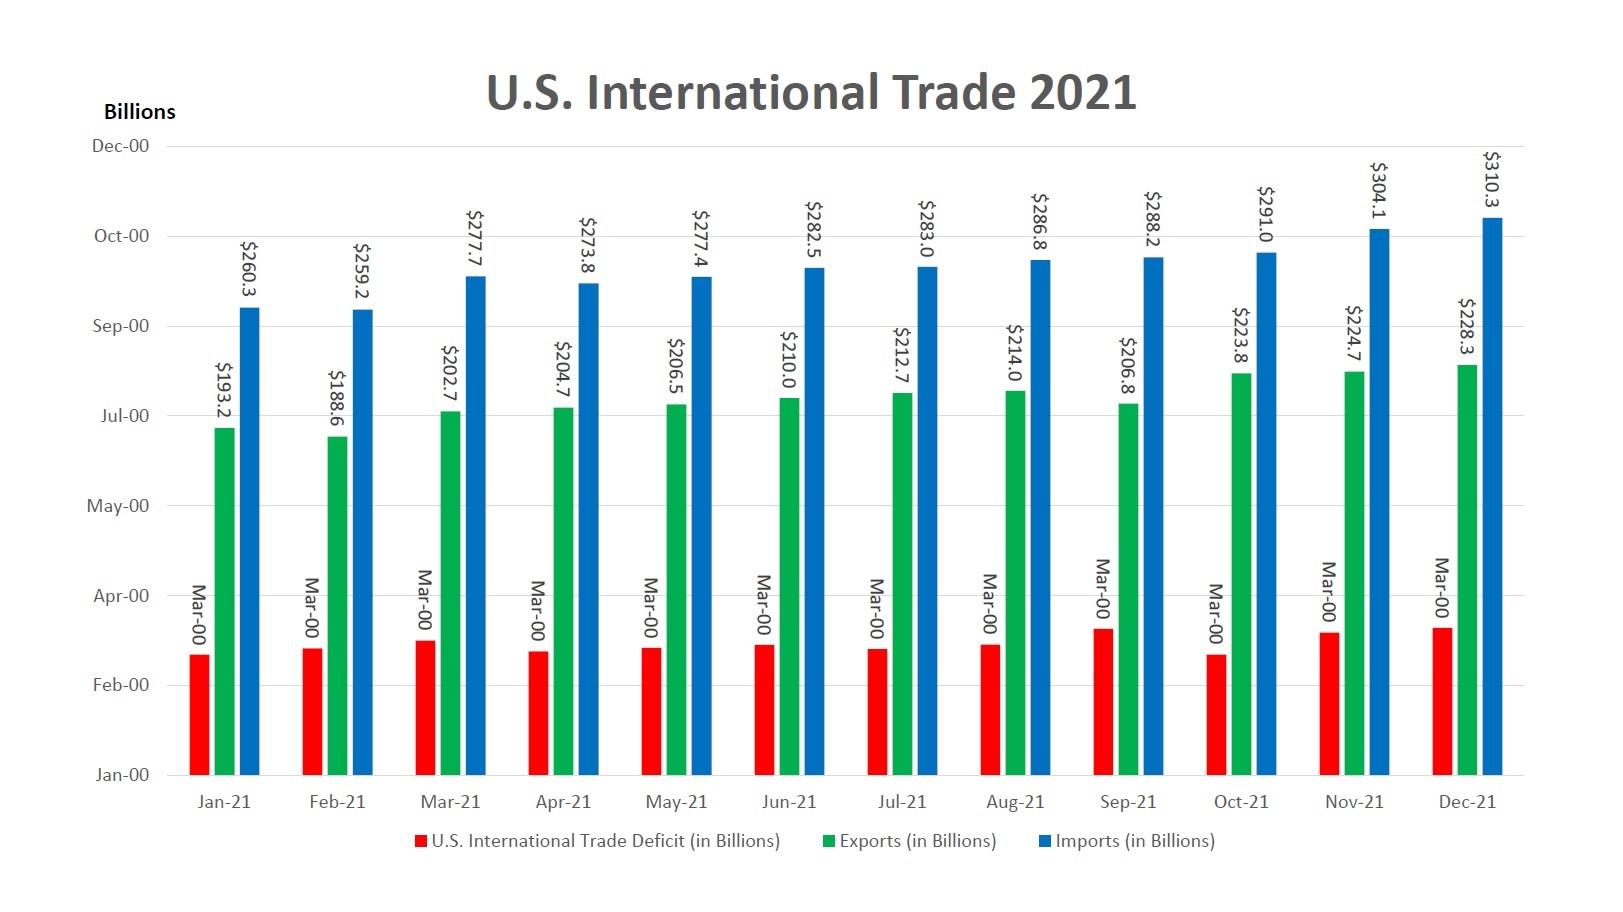
International Trade
International Trade as of May 2026
The May 2026, annualized deficit, export and import U.S. International Trade charts have been added to the bottom of this page.
Exports decreased in May 2026 from April 2026 ($328.2 to $317.7 billion). Imports increased in May 2026 from April 2026 ($382.8 billion to $395.3). The trade deficit increased in May 2026 ($77.6 billion) from April 2026 ($54.6 billion).
State Unemployment
State Unemployment as of June 2026
2 states (Oklahoma and Utah) have a higher number of average monthly number of unemployed in 2026 (thru June) than 2008.
42 states have a higher number of average monthly number of unemployed in 2026 (thru June) than 2025.
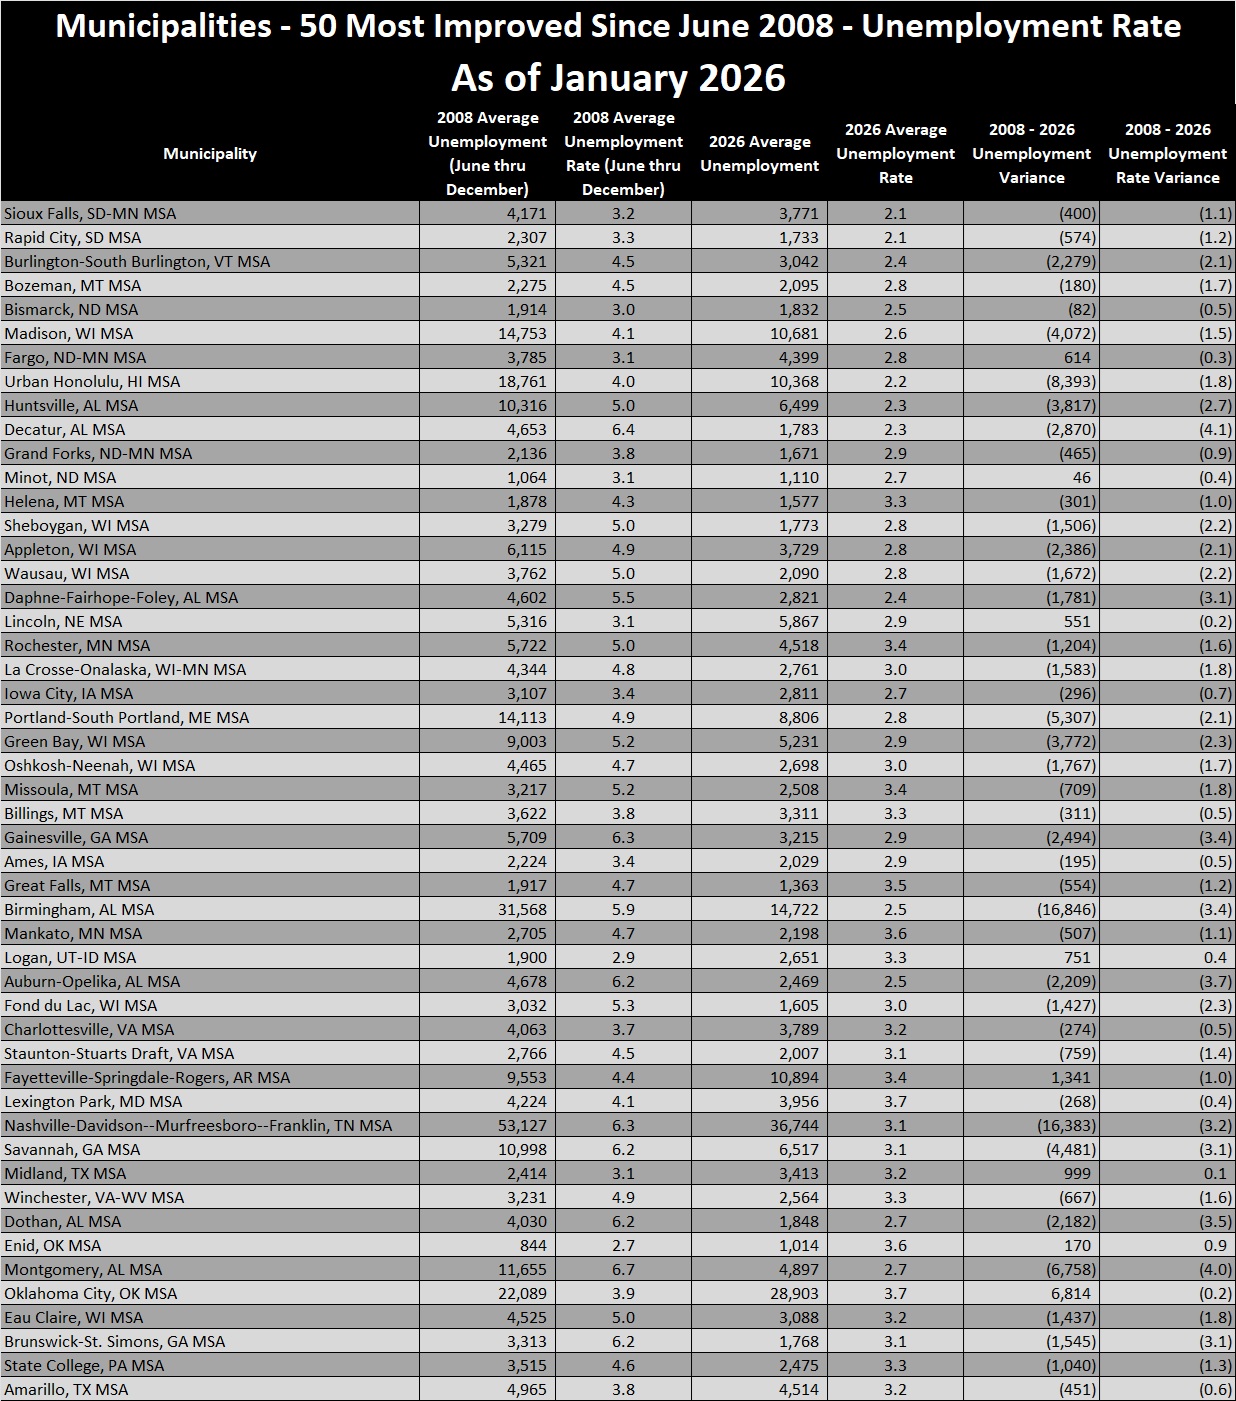
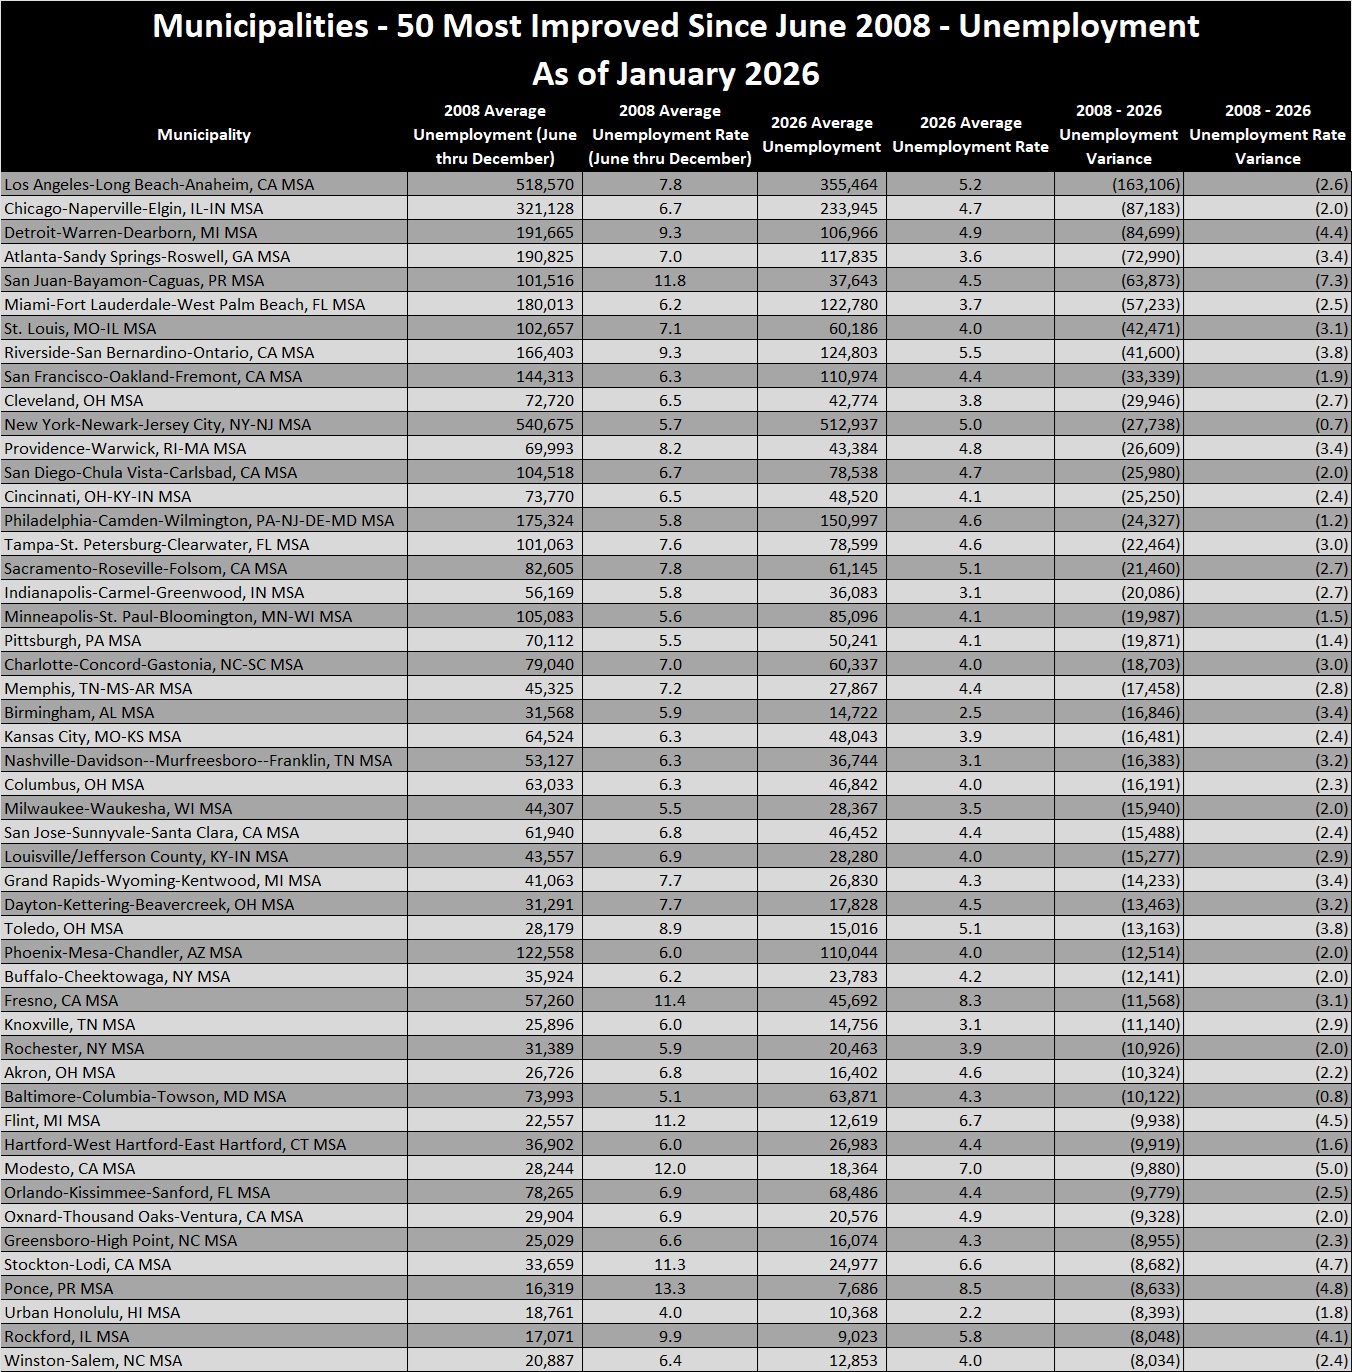
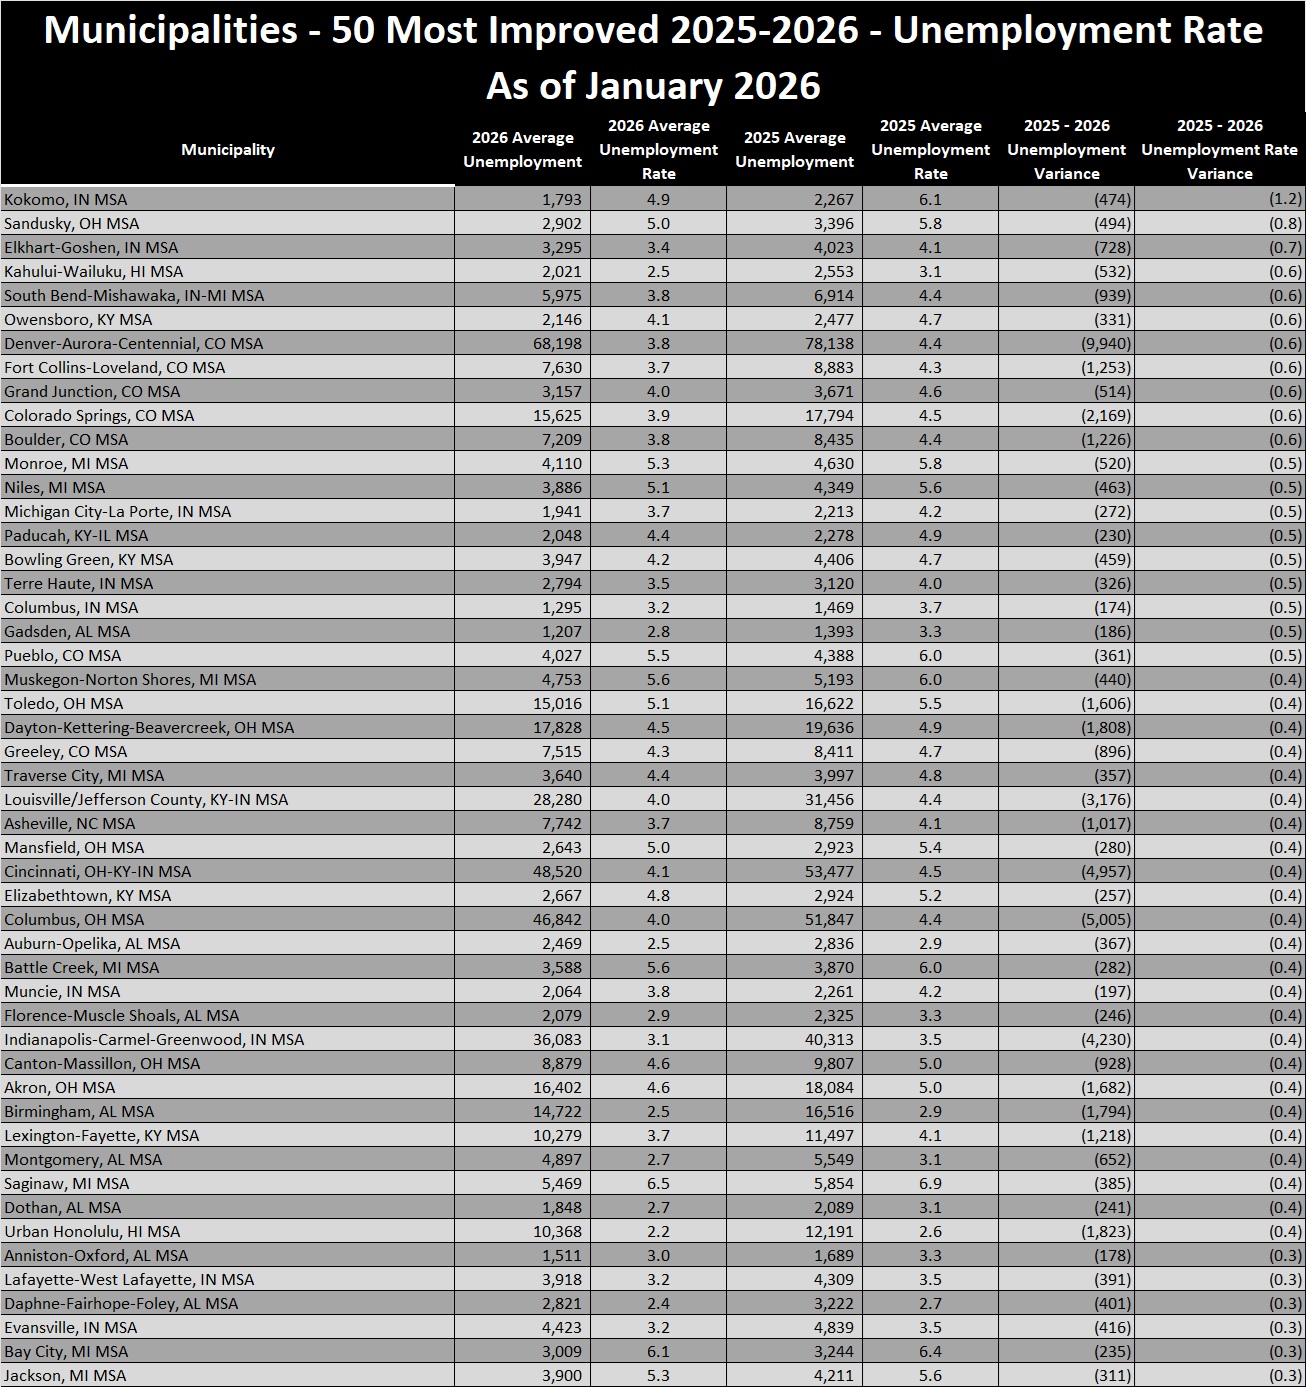
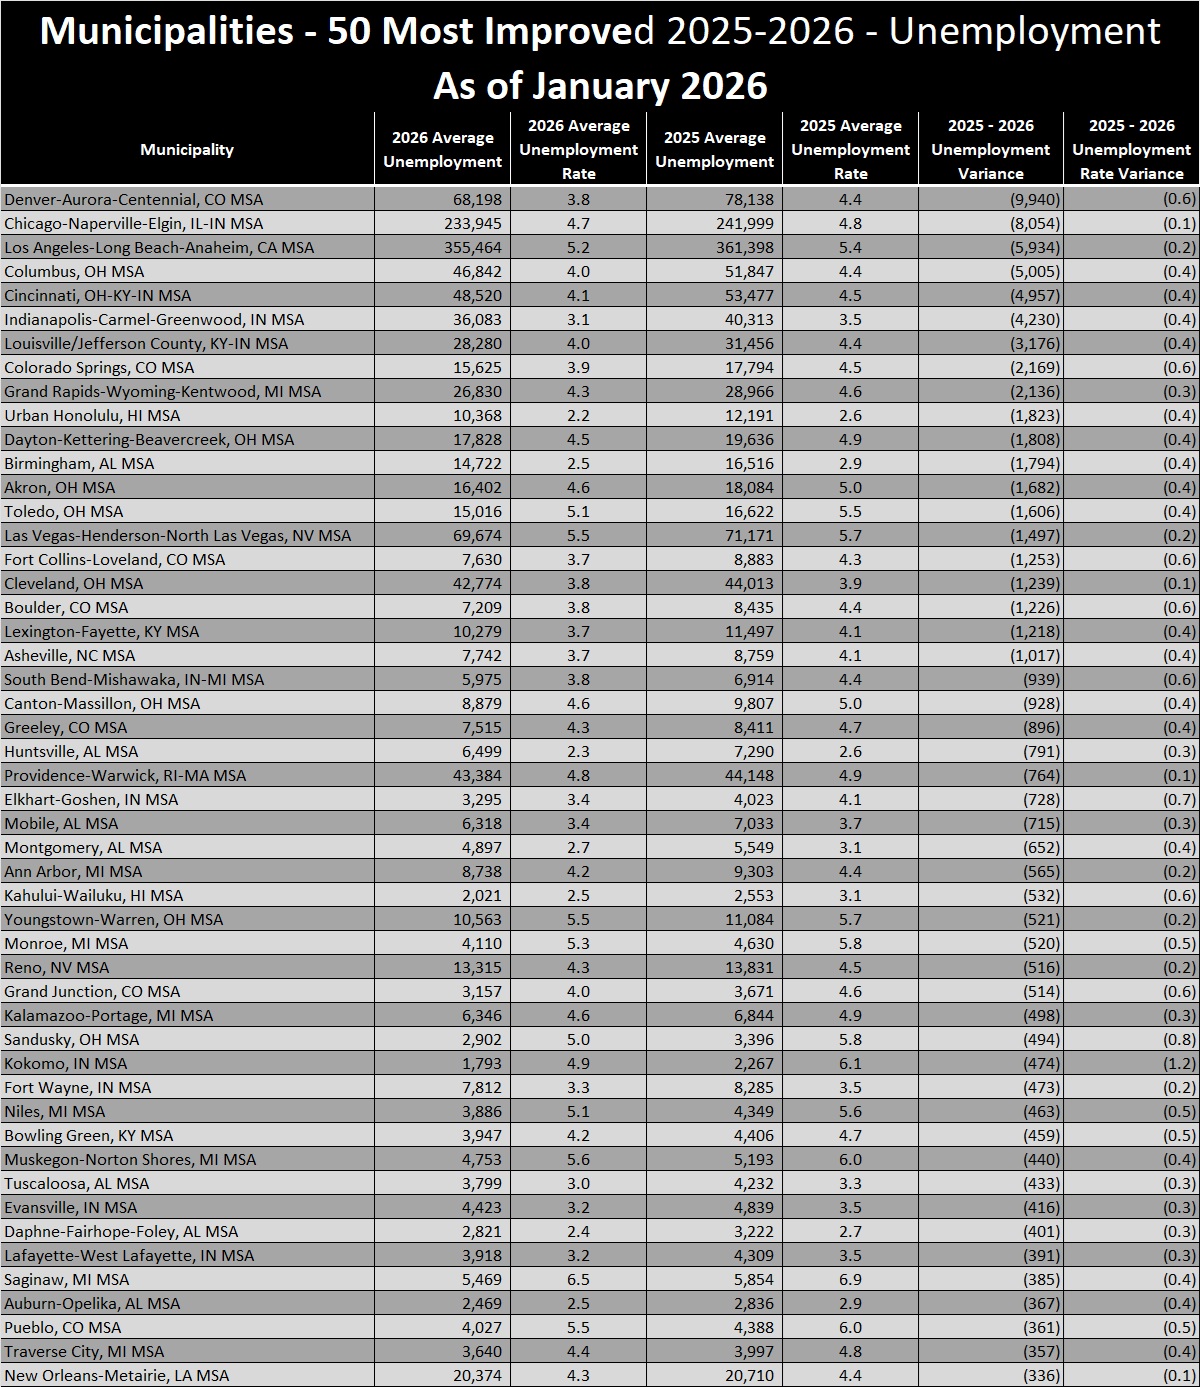
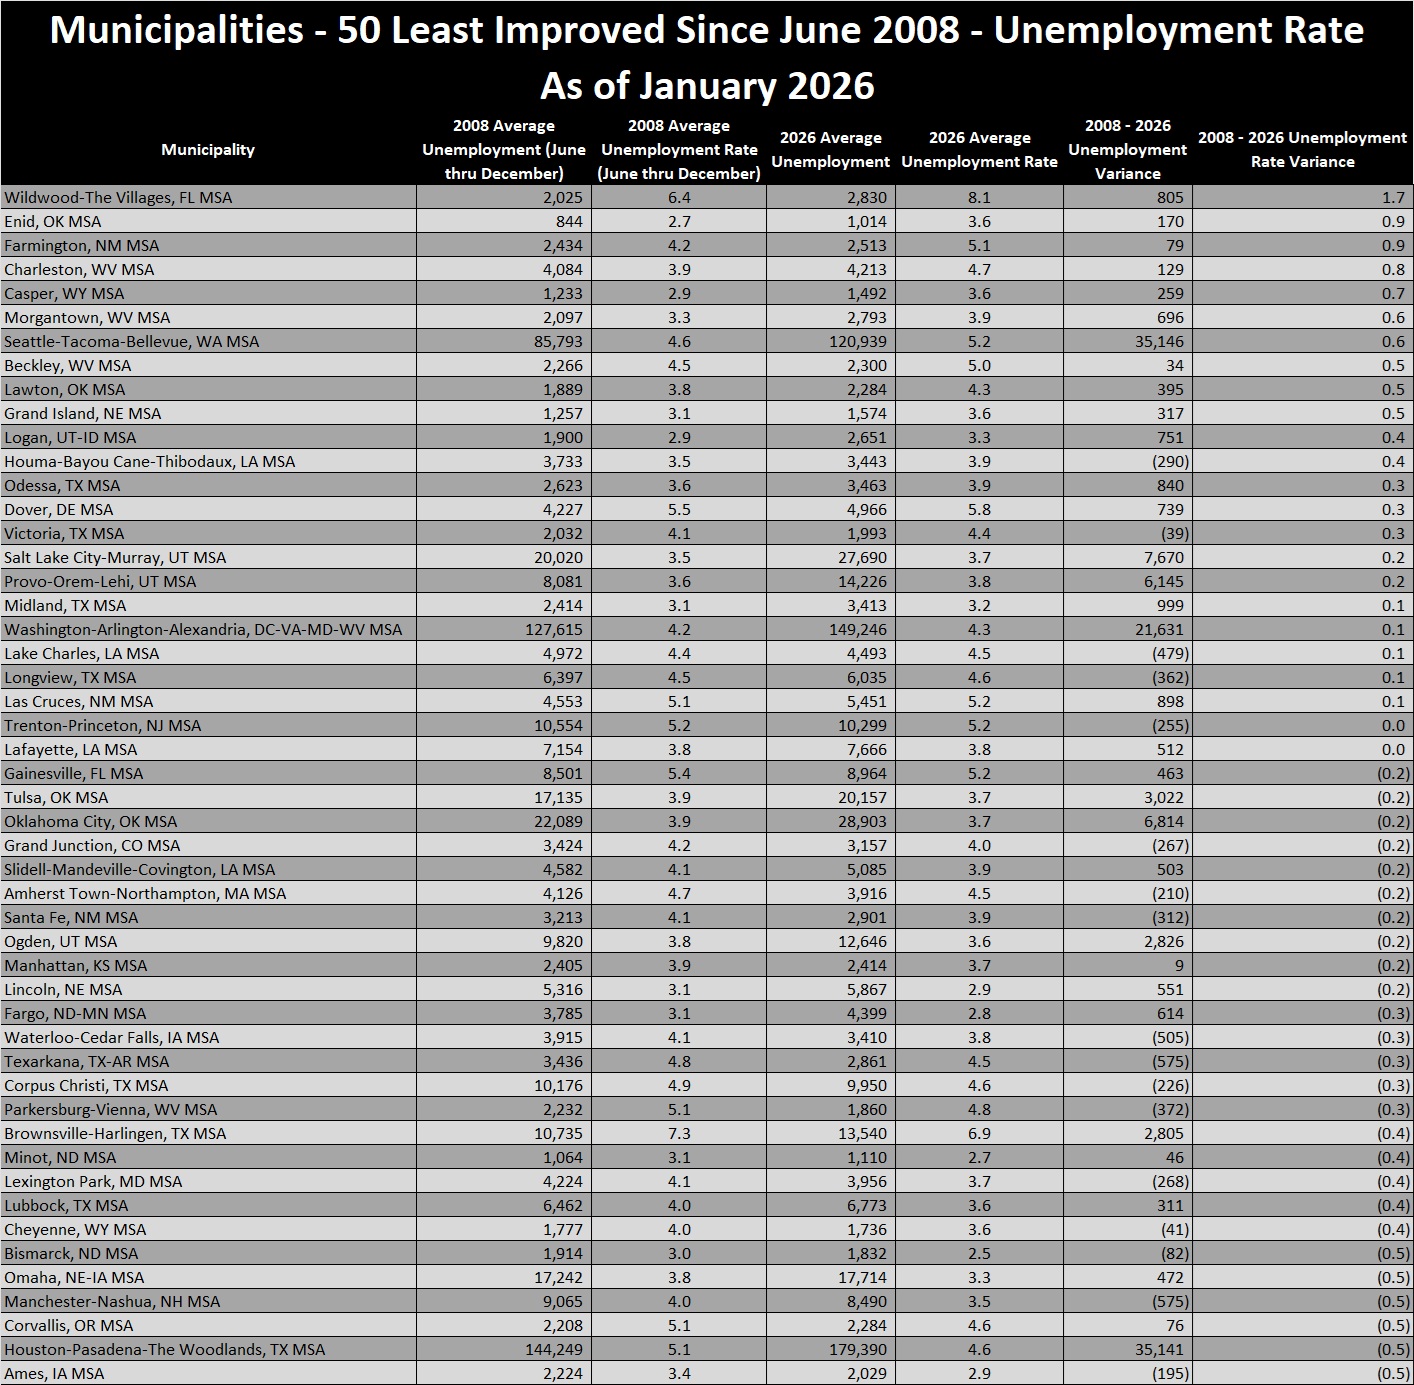
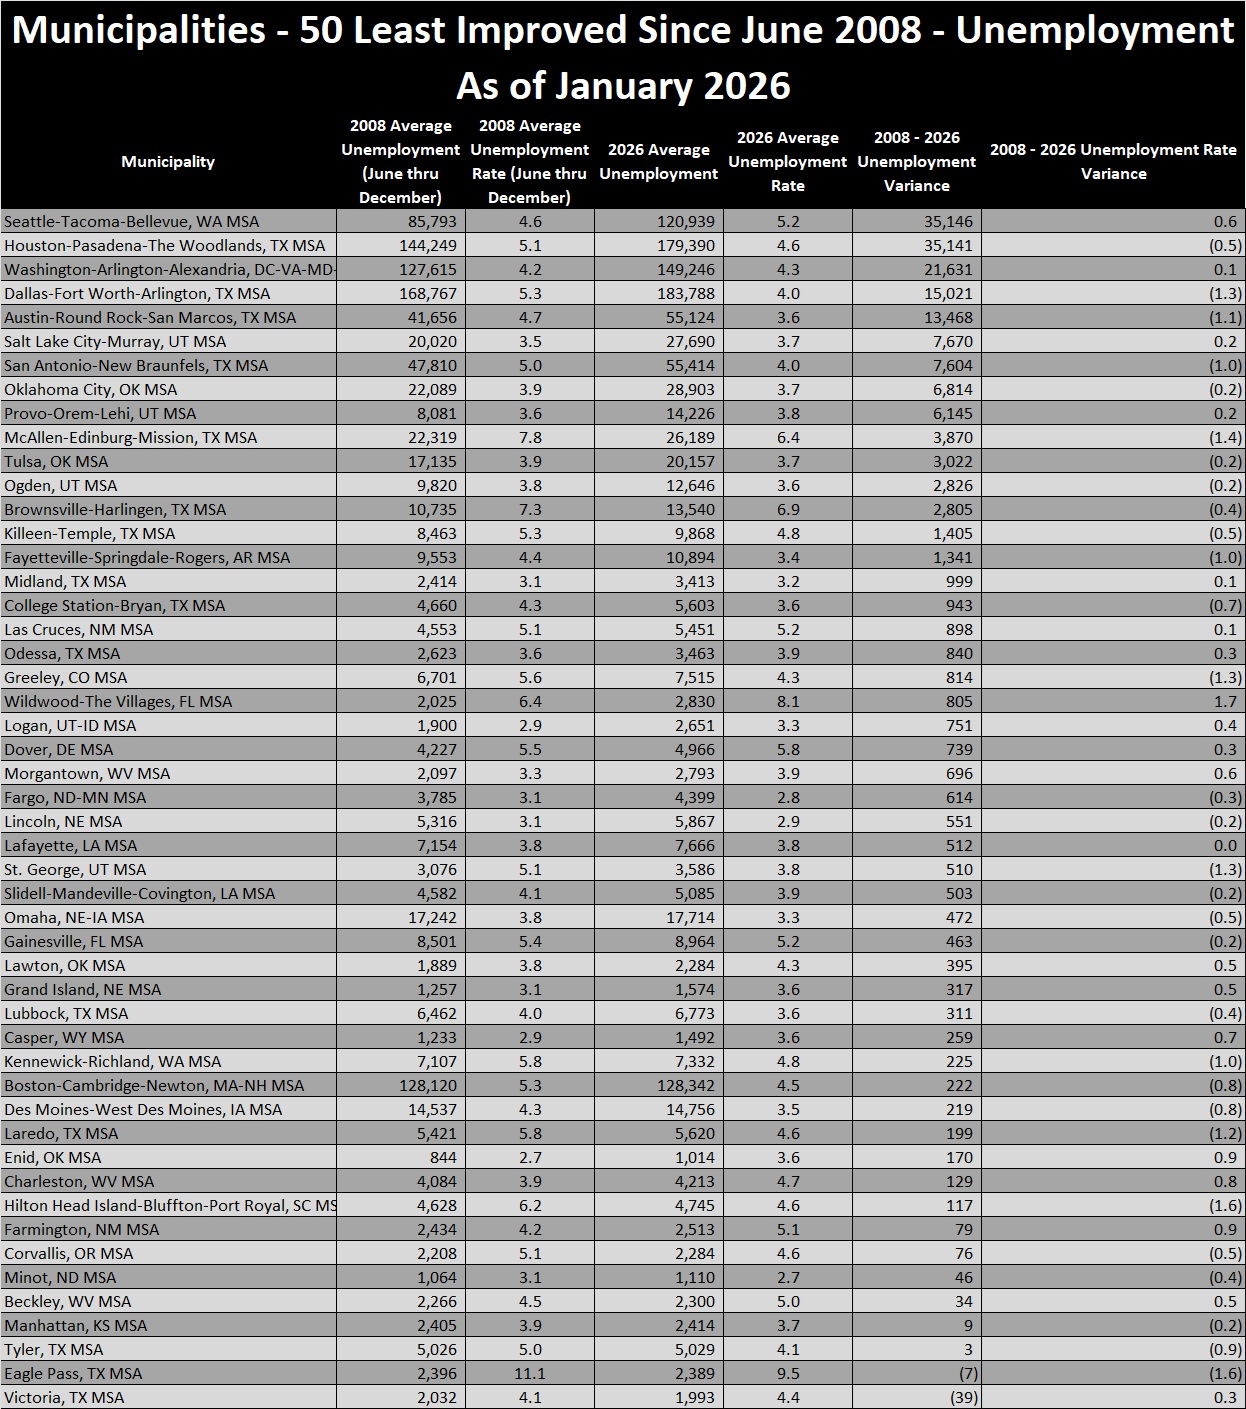
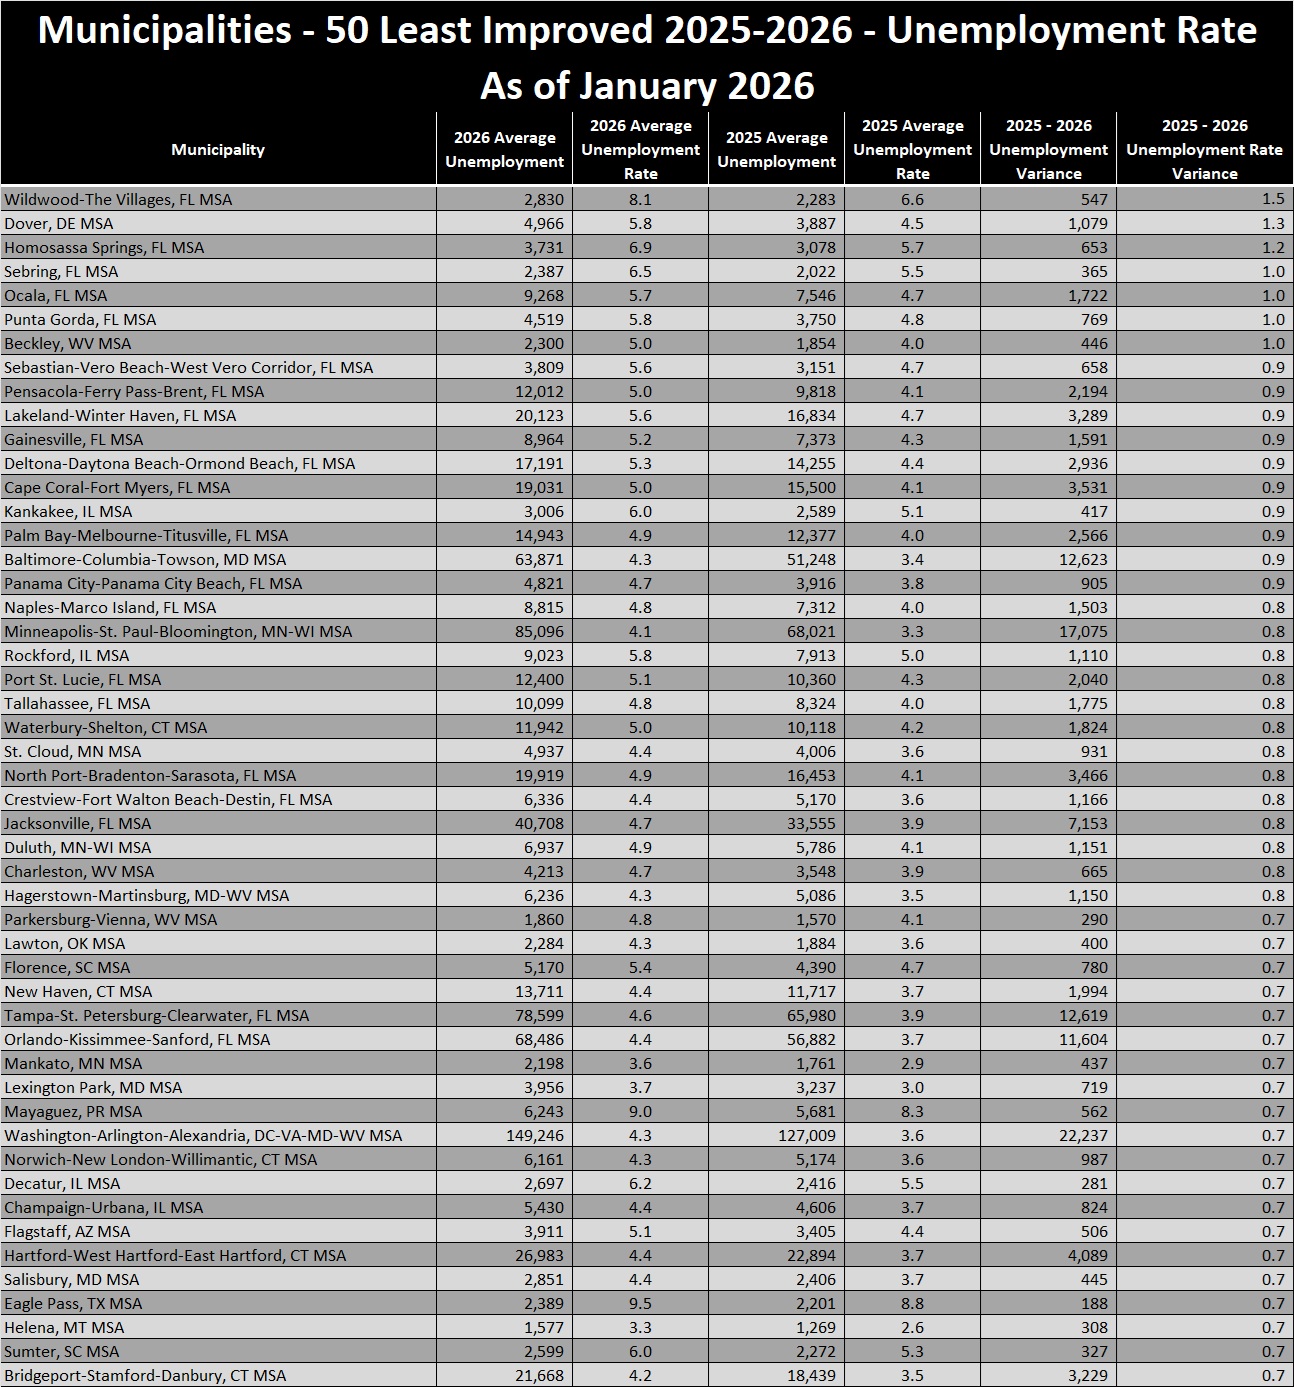
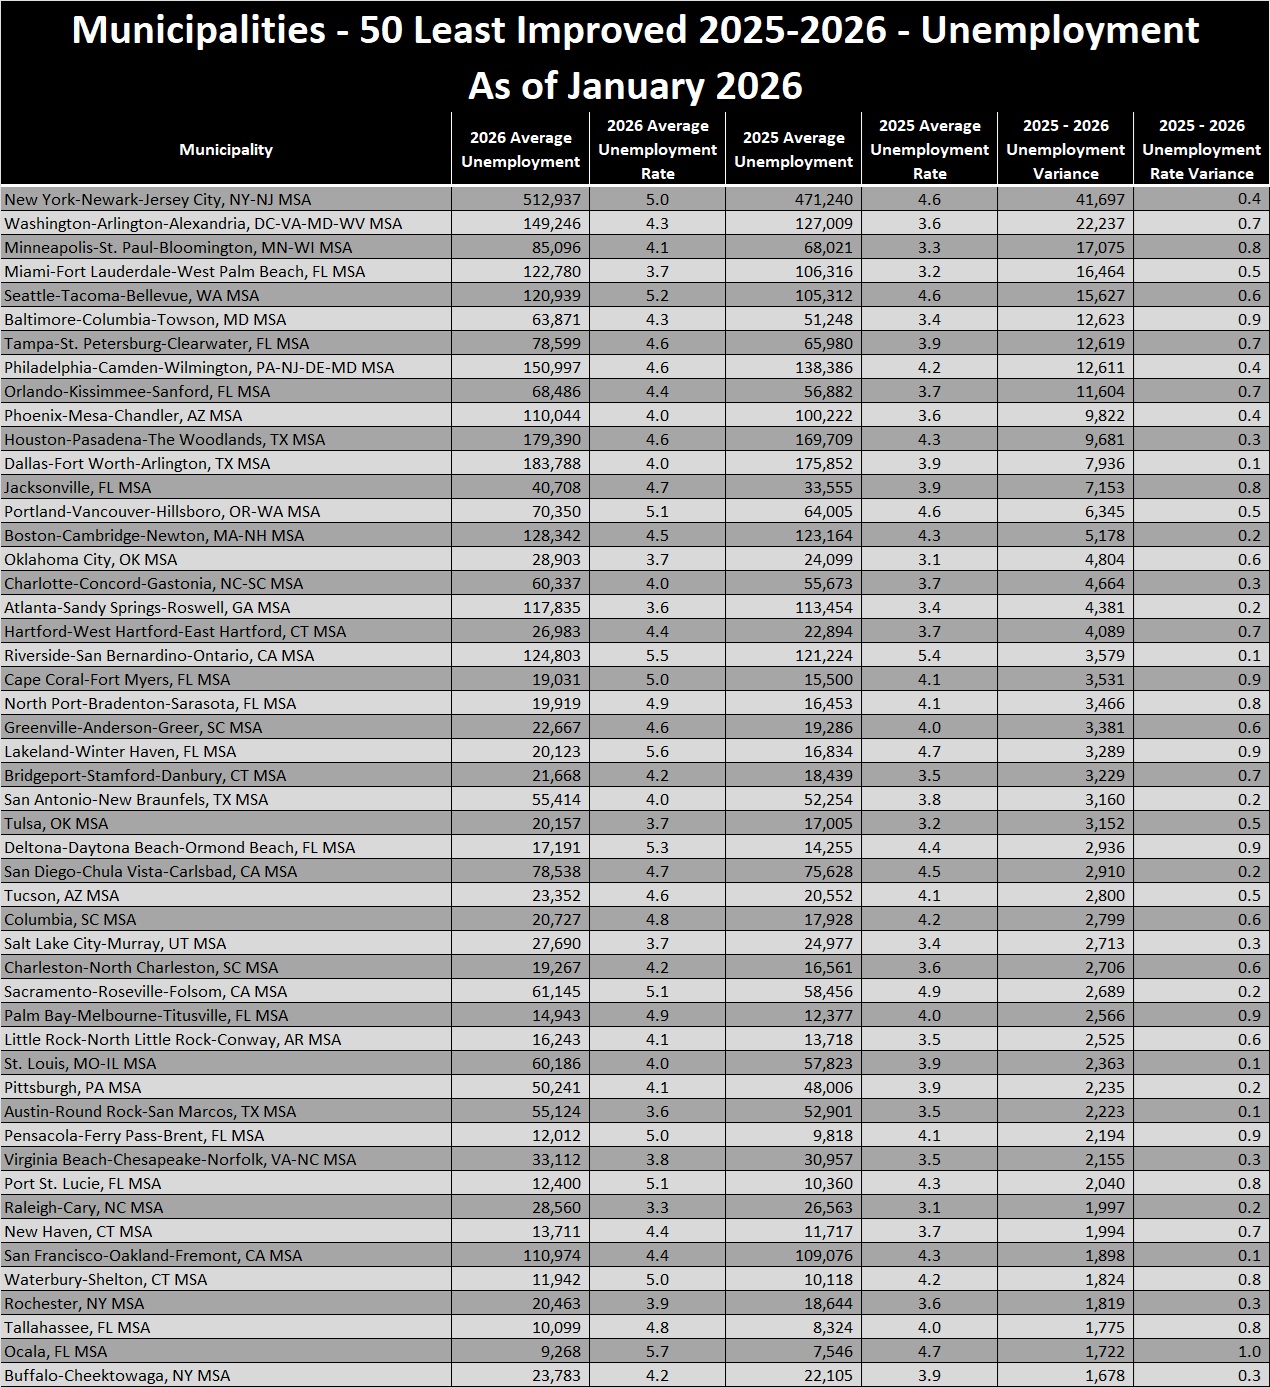
Municipality Unemployment
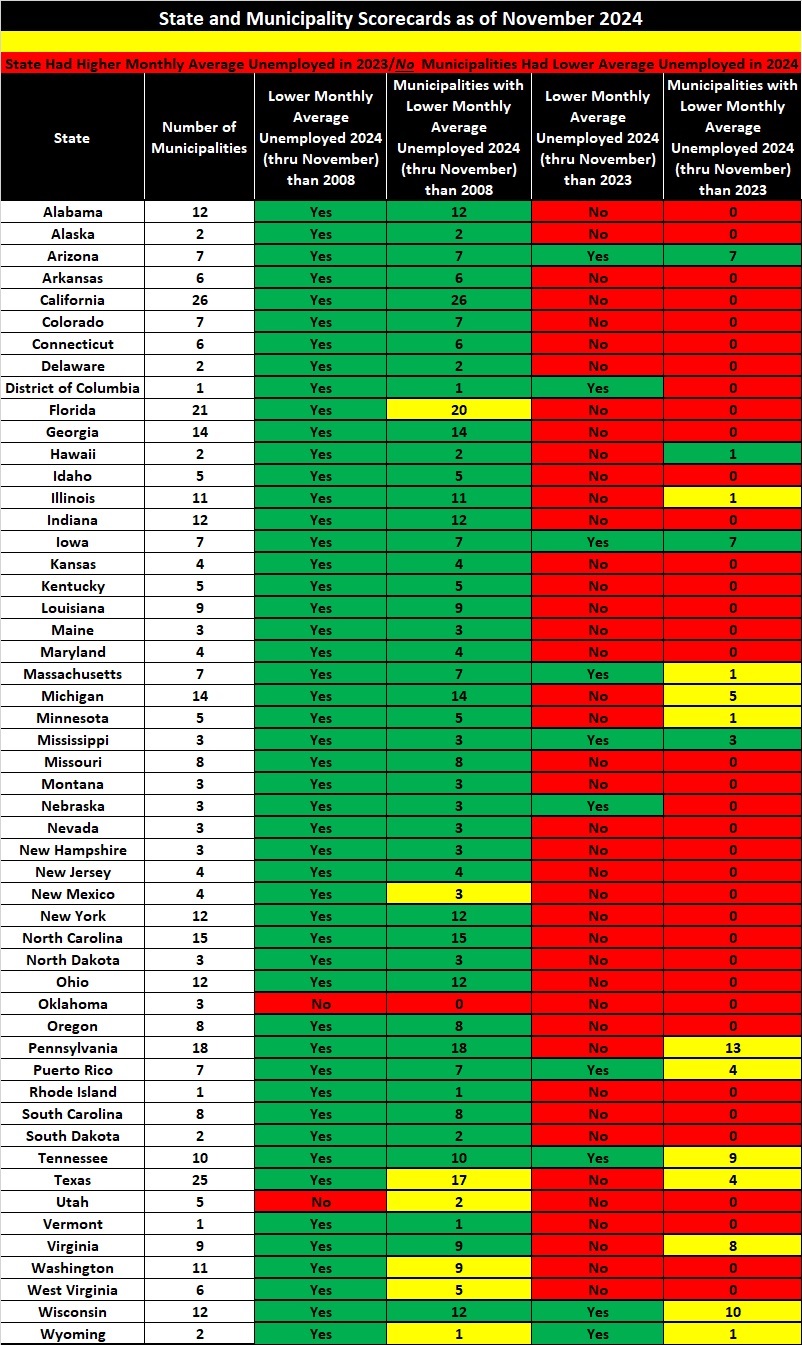
Municipality Unemployment as of May 2026
346 of the 388 municipalities (89.2%) have an average monthly number of unemployed lower in 2026 than 2008. (May 2026)
Smoothed Seasonally Adjusted Metropolitan Area Estimates Are Current as of May 2026.

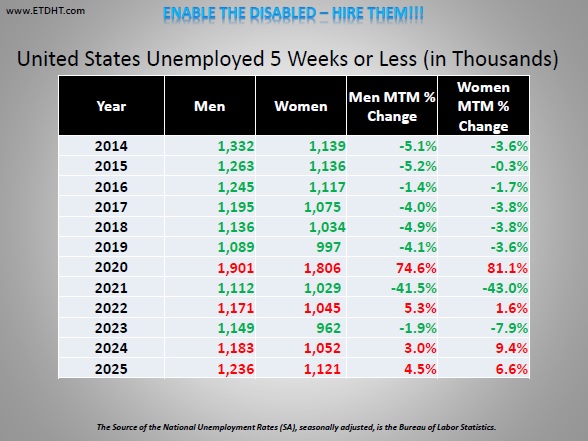
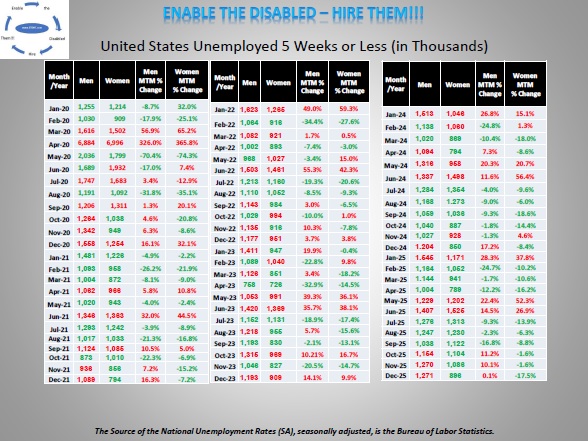
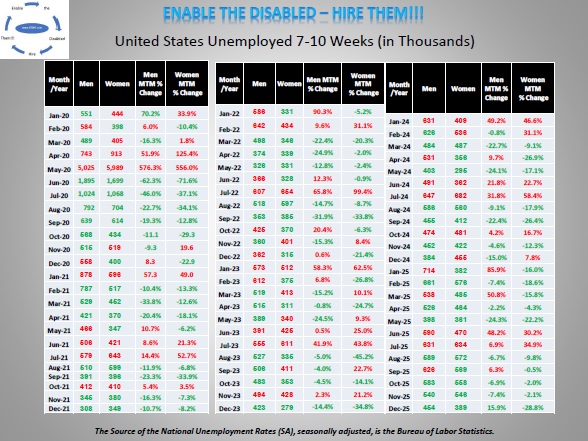
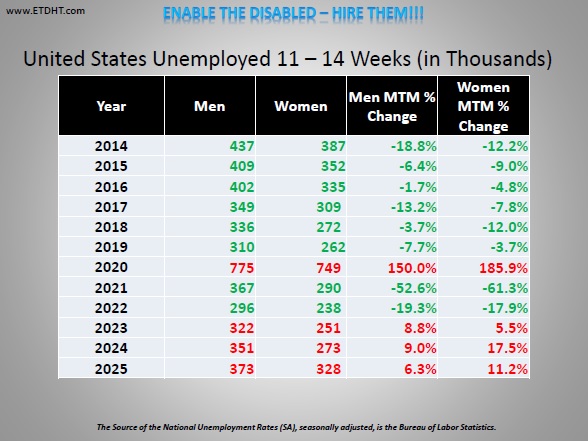
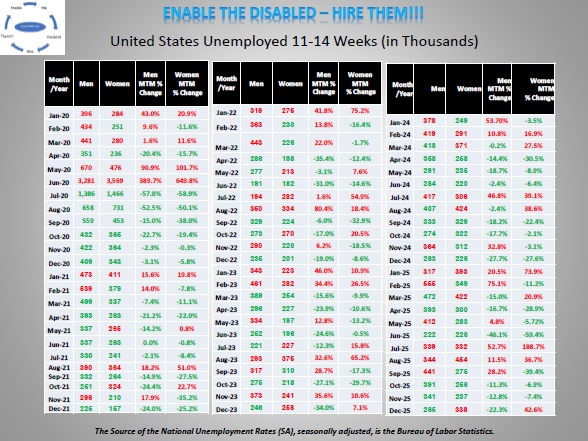
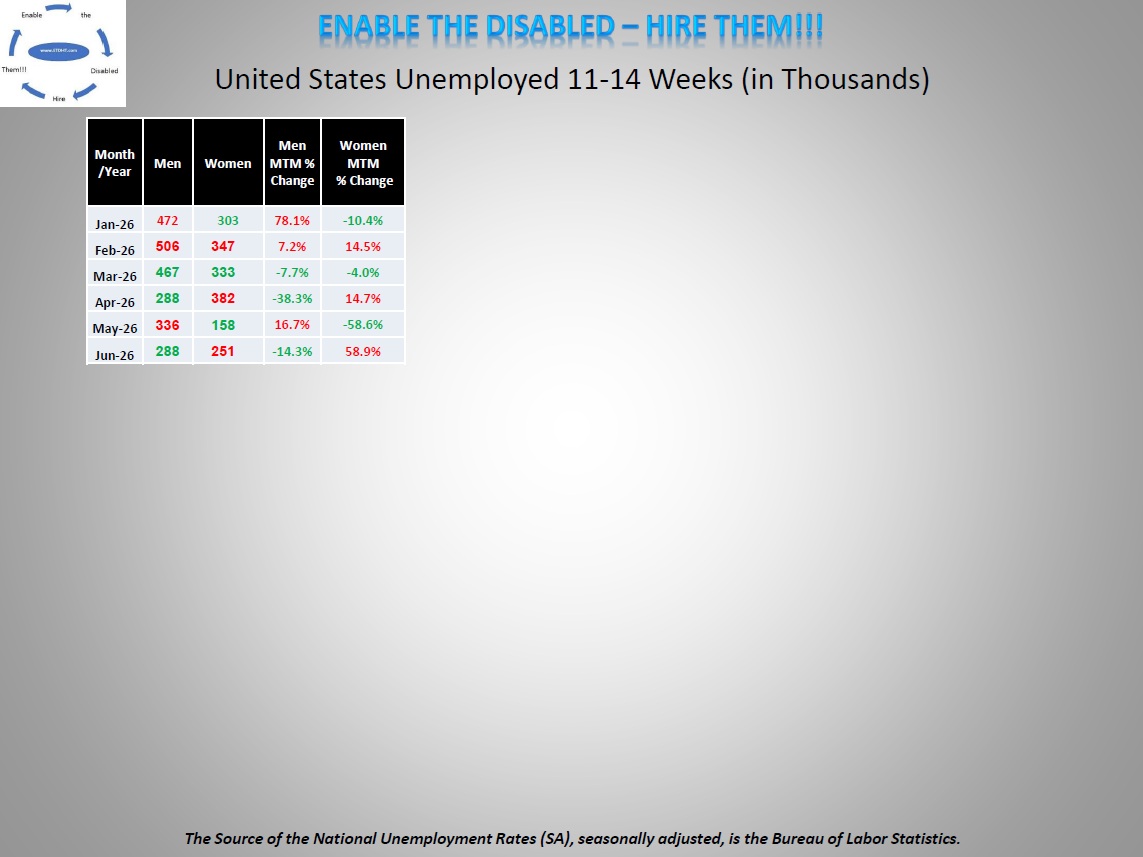
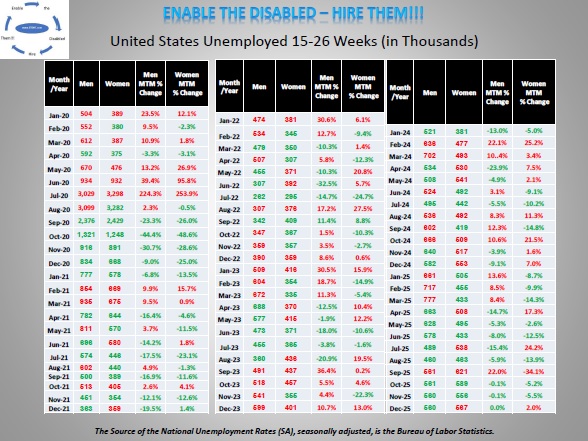
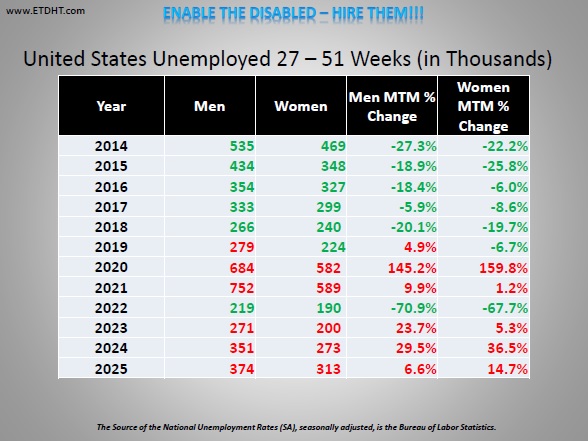
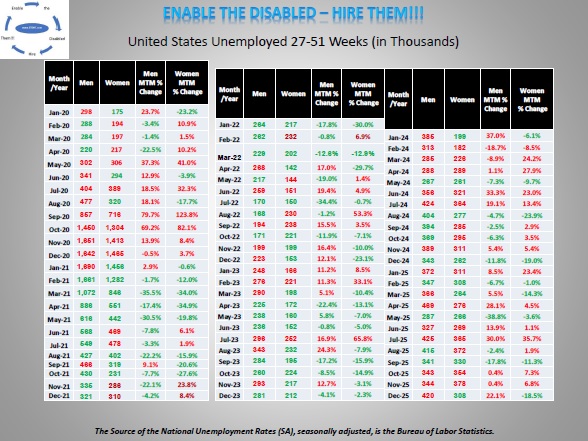
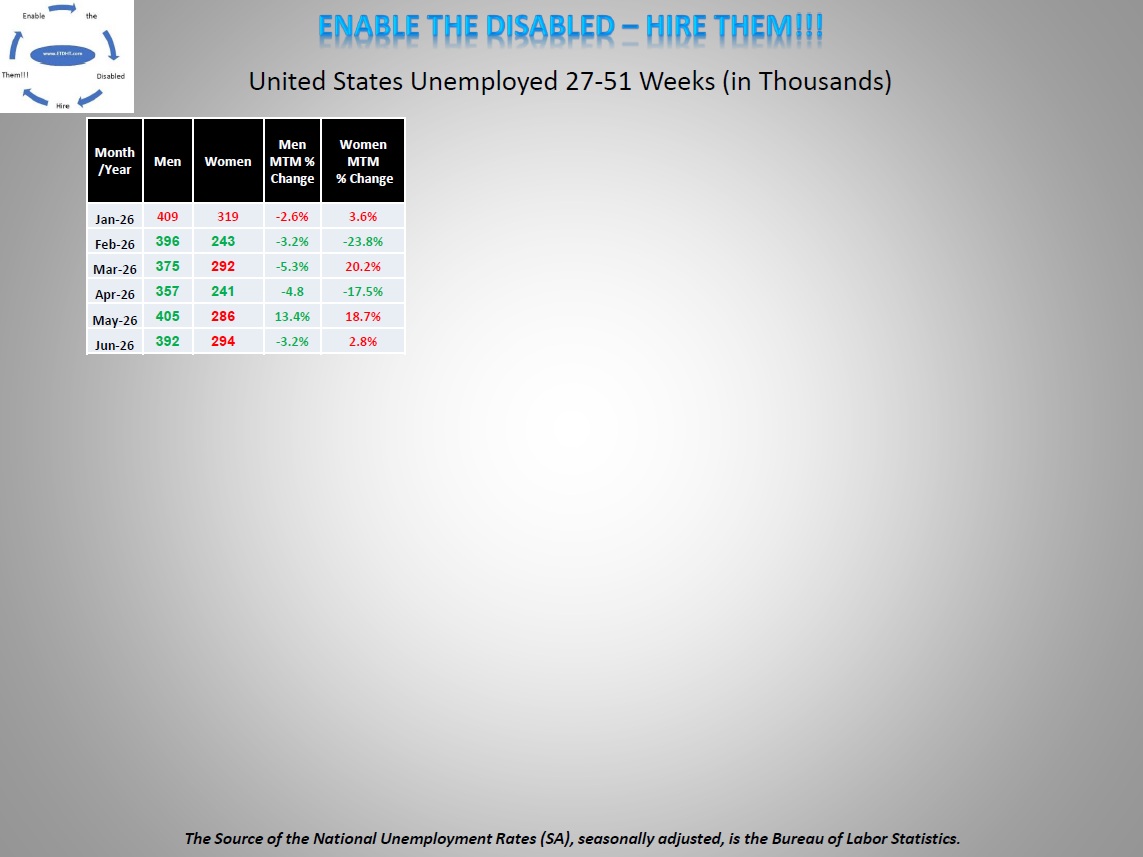
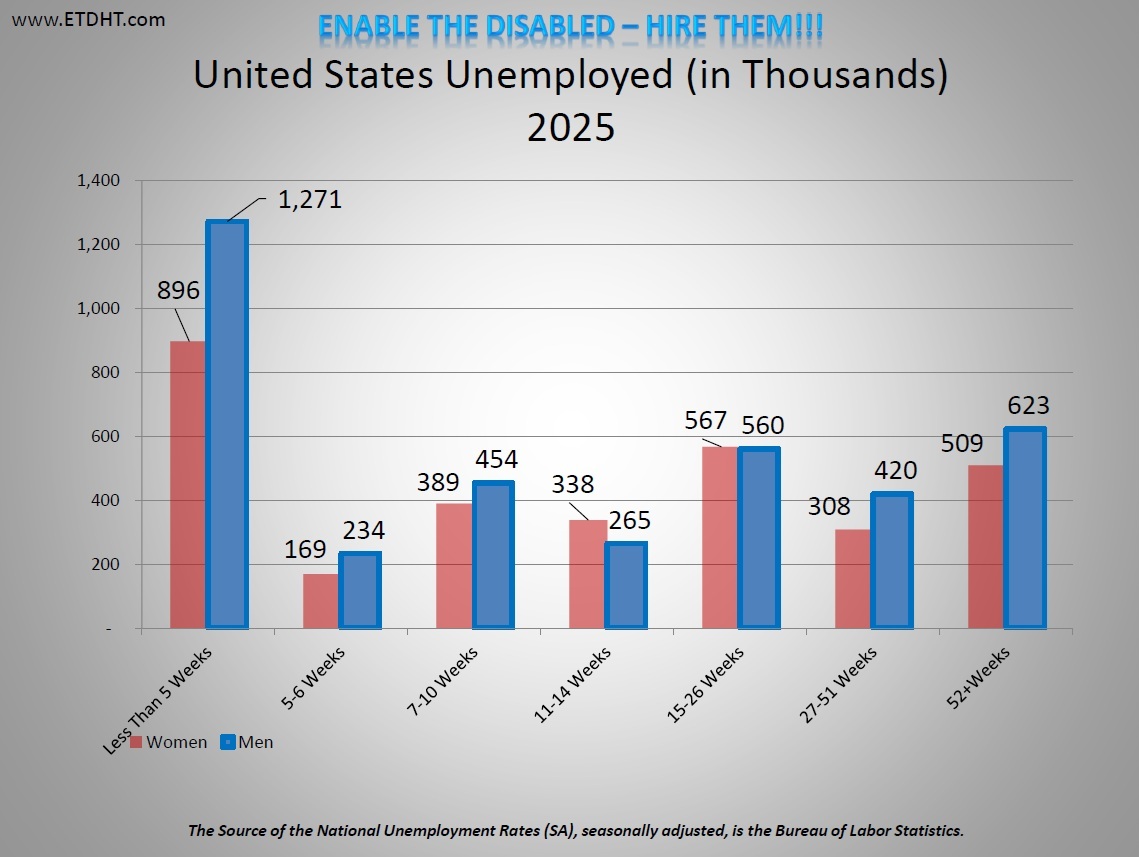
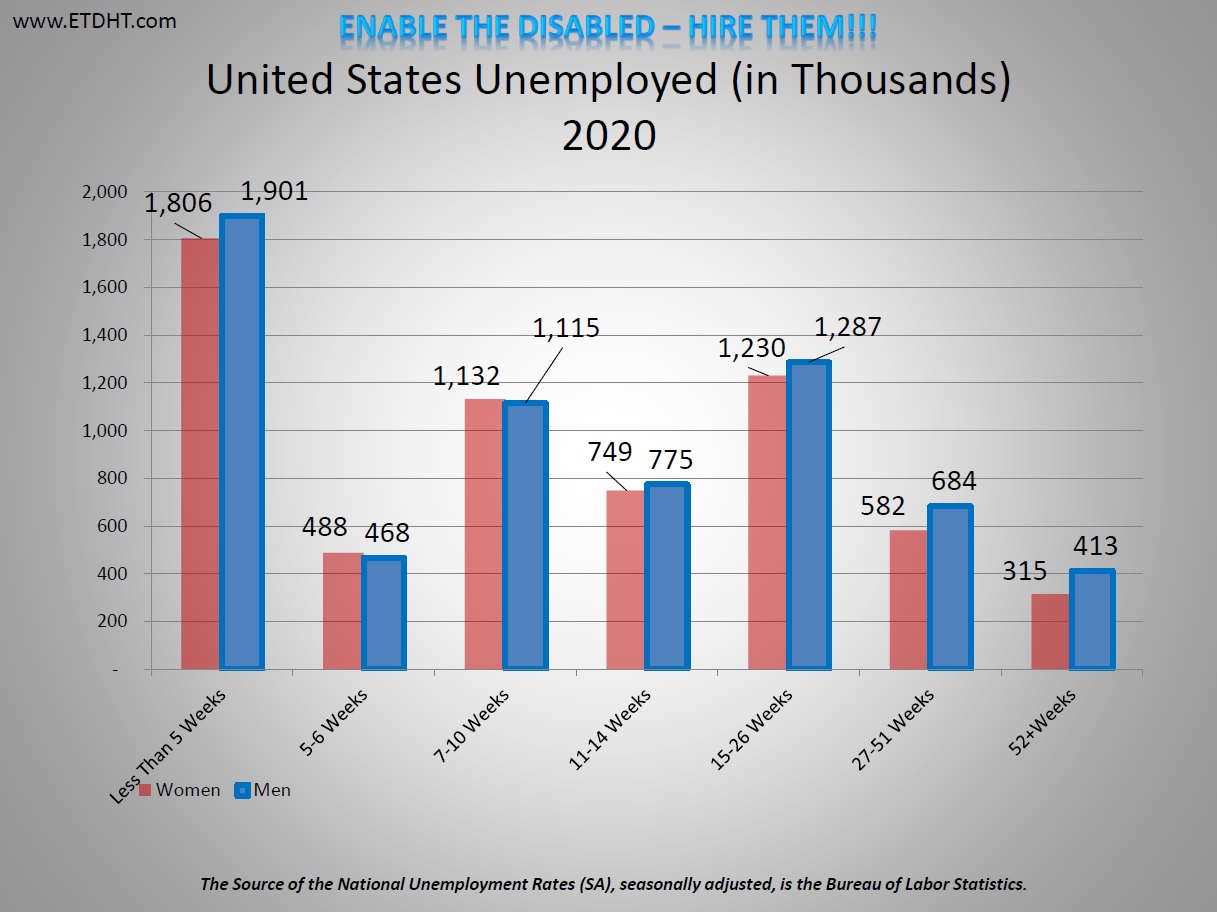
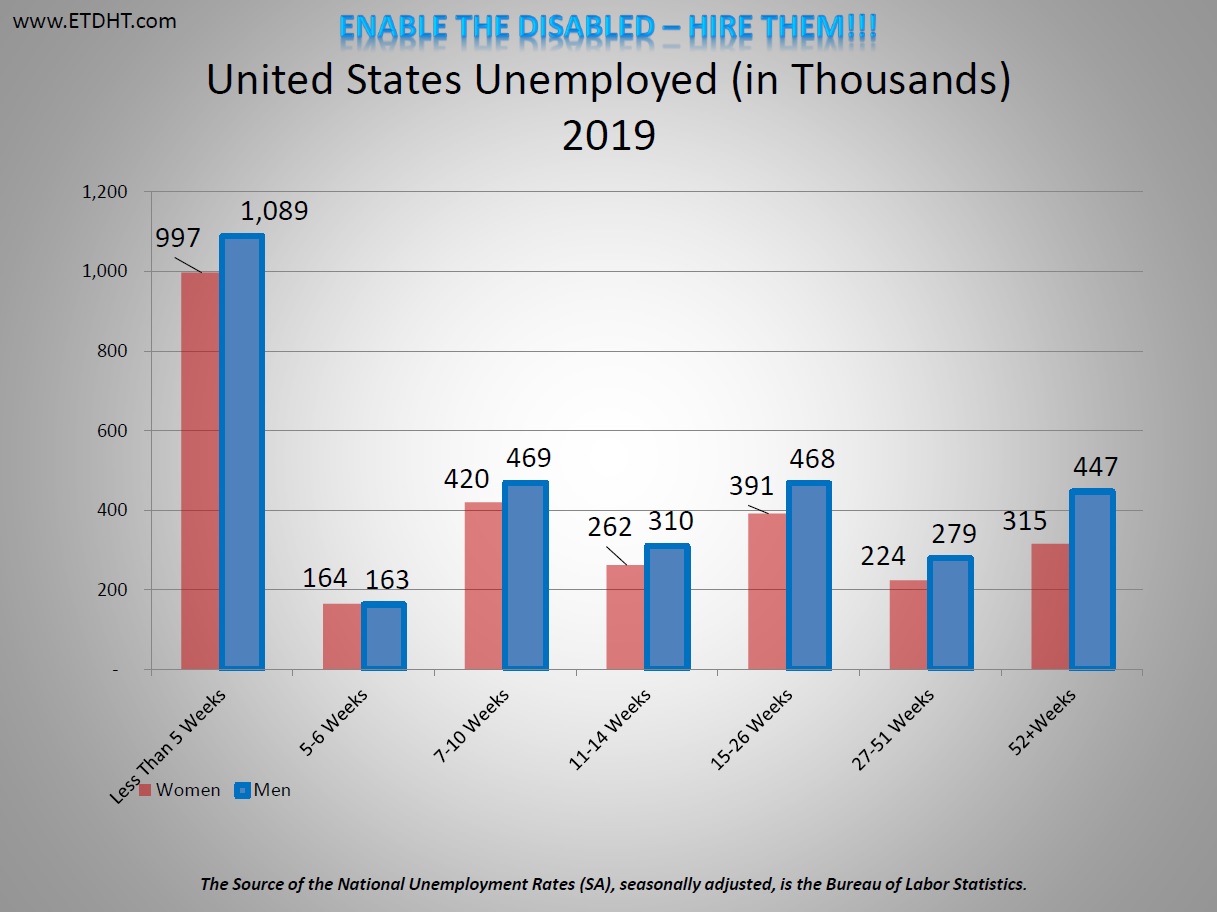
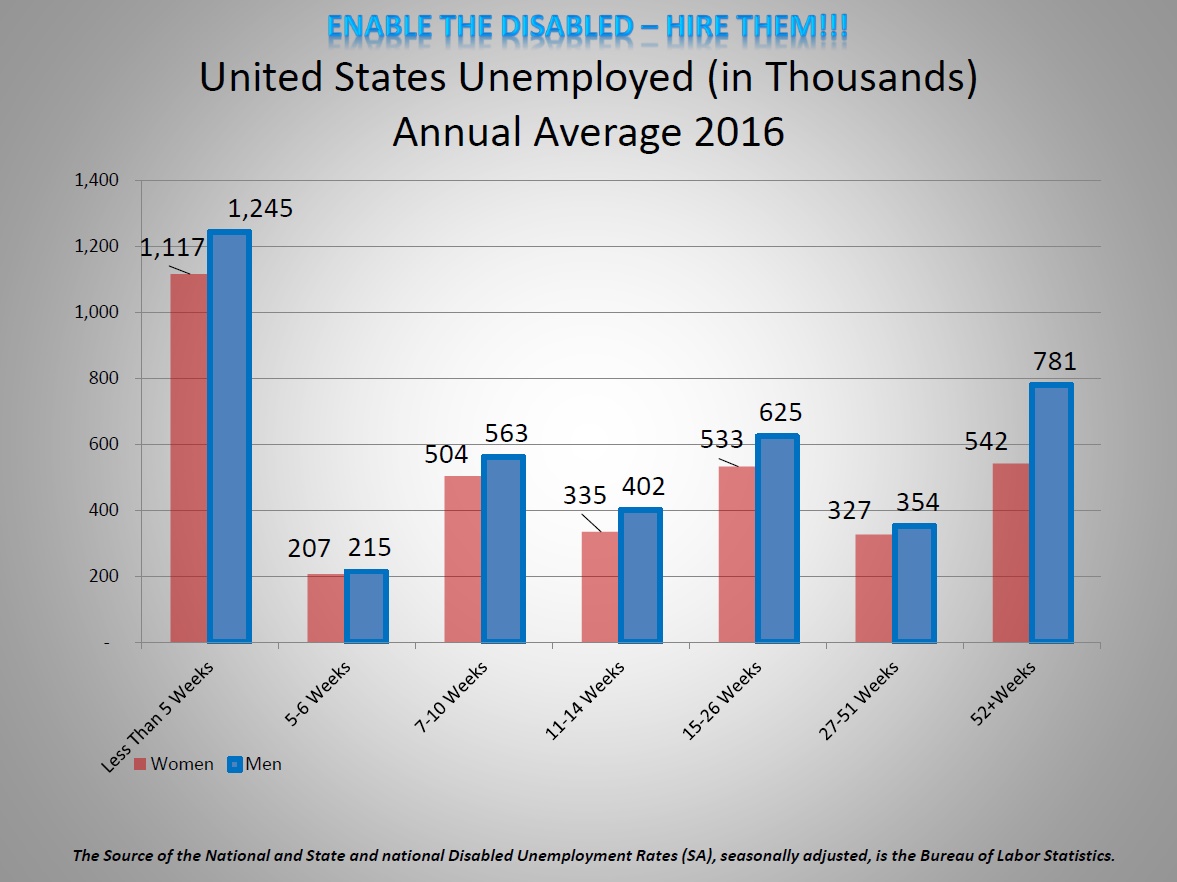
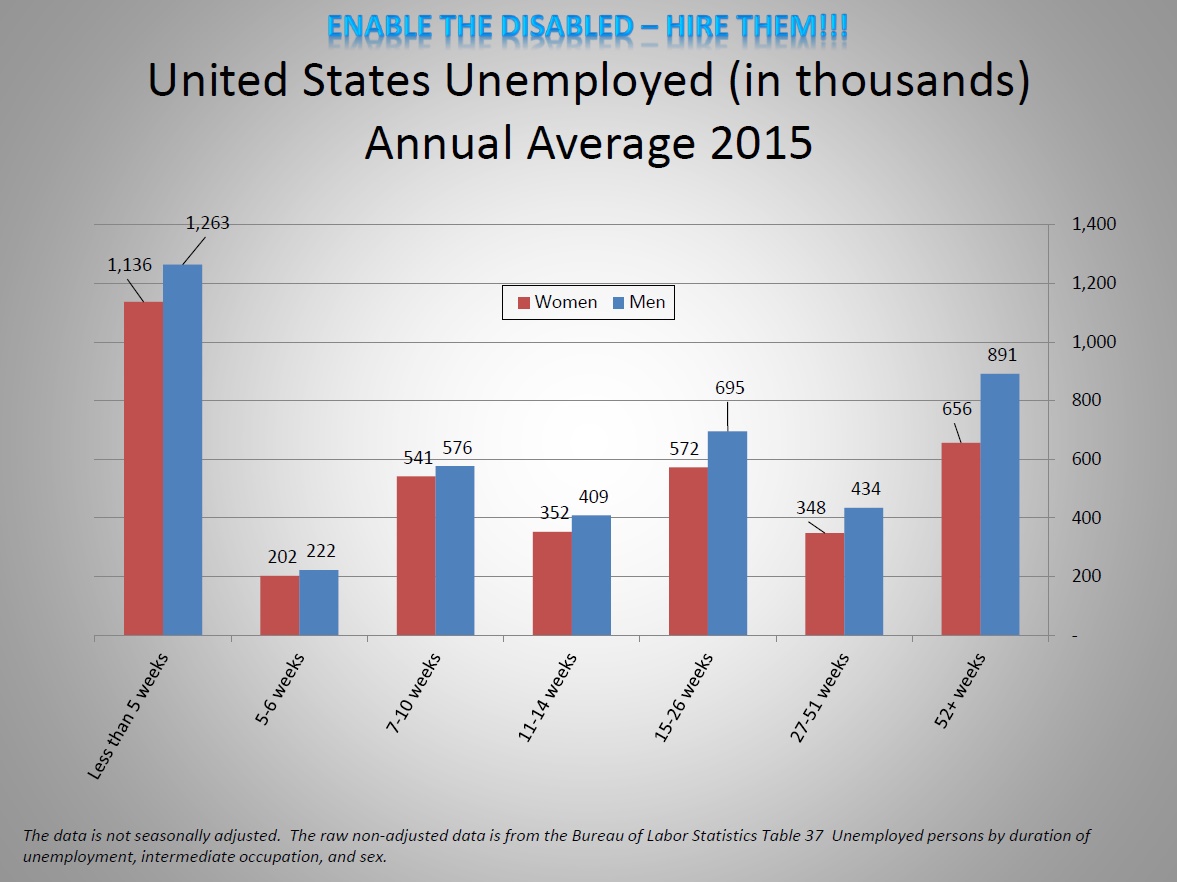
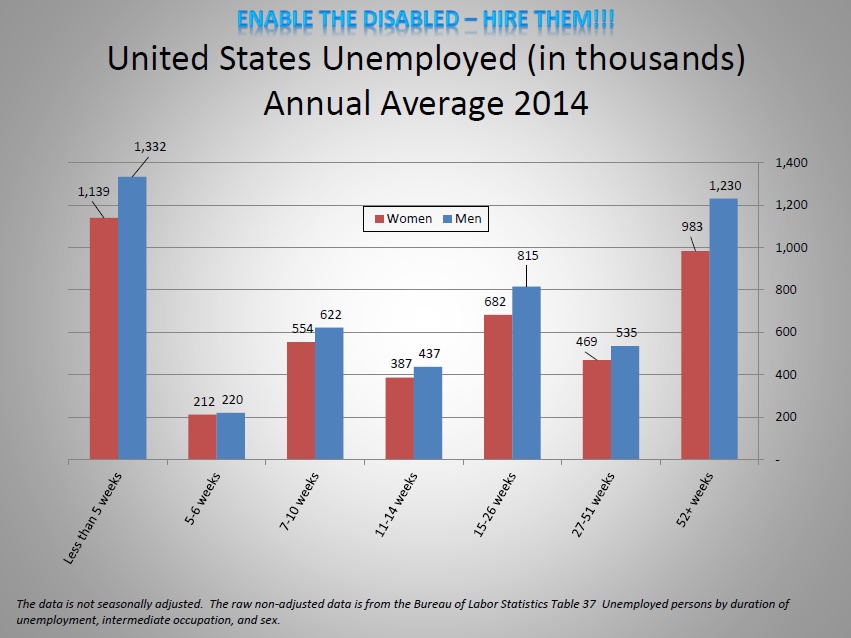
Unemployed by Length of Unemployment


SSI is Critical for Children with Developmental and Behavioral Disabilities
_________________________
Since we are constantly being bombarded by statistics on TV and on social media sites, here are 4 toolkits from the U.S. Census Bureau aimed at children (but don’t be ashamed or scared to learn from them if you’re an adult) to help us learn more at different levels.
Parent/Caregiver Toolkit Easy At-Home Learning With Statistics in Schools – Pre-K
Parent/Caregiver Toolkit Easy At-Home Learning With Statistics in Schools – Elementary Schools
Parent/Caregiver Toolkit Easy At-Home Learning With Statistics in Schools – Middle School
Parent/Caregiver Toolkit Easy At-Home Learning With Statistics in Schools – High School
__________________________________________________________________________
Municipalities Most Improved
Presidents

Municipalities
Least Improved
State and Municipality Scorecard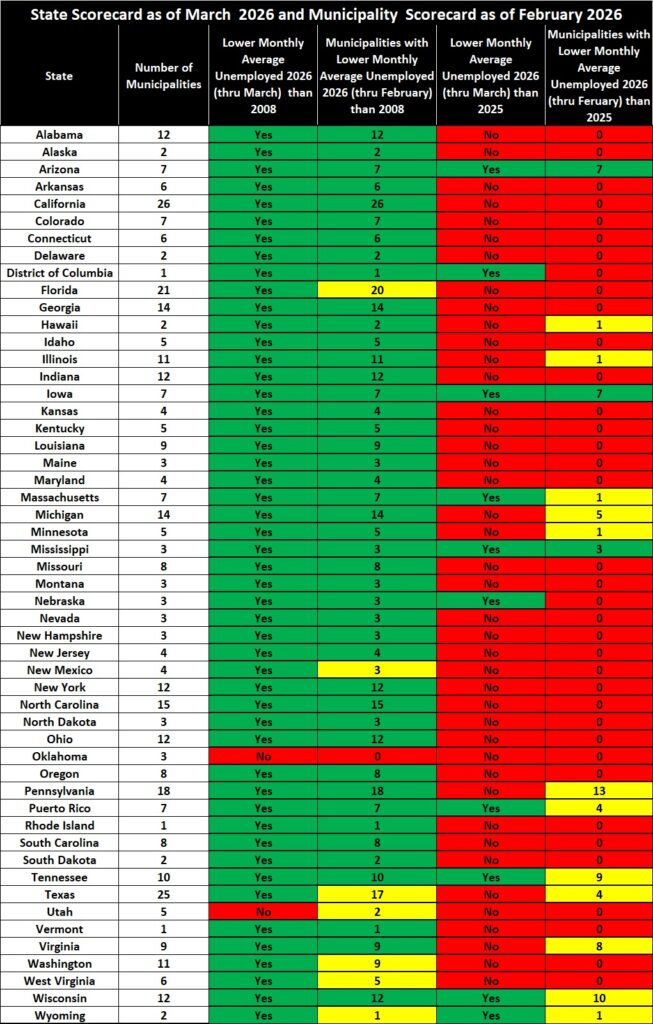
Schedule
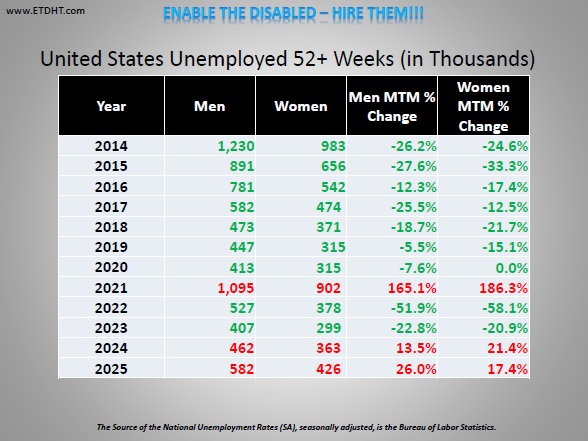
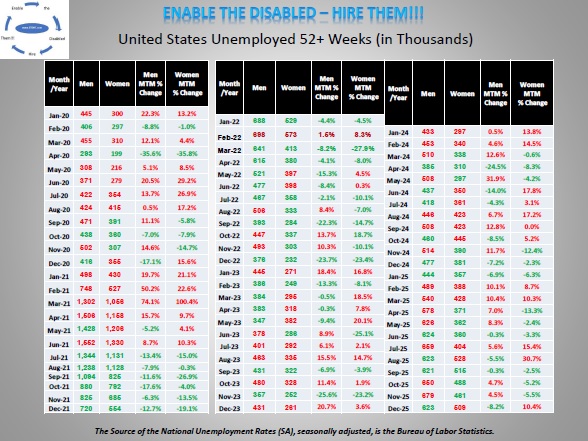
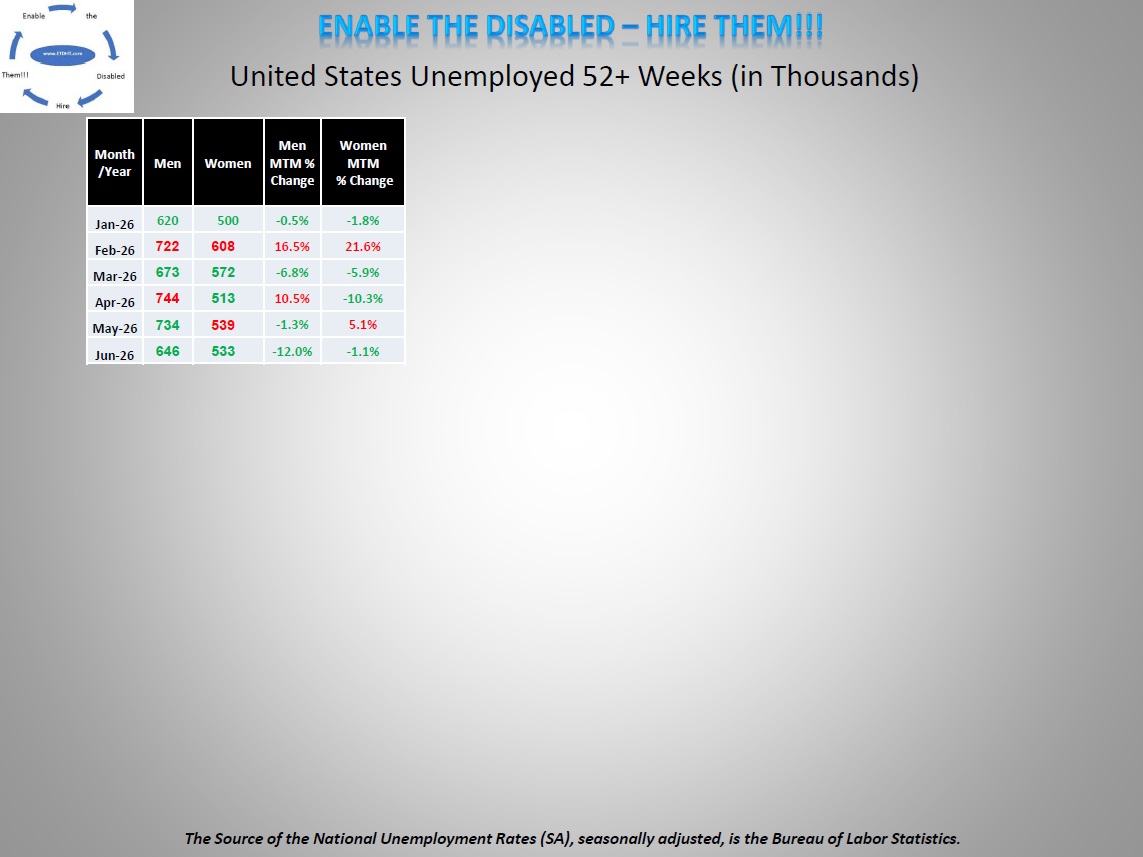
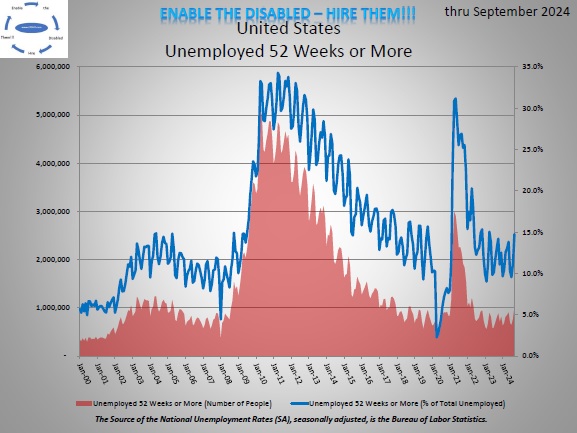
The percentage and number of those unemployed over 52 weeks decreased for the month of June 2026 (14.7%) 1,039,786 from May 2026 (17.3%) 1,301,575. (See Unemployed 52 Weeks or Longer)
Unemployed Over 52 Weeks
Links to State Governors, U.S. Senators and U.S. House of Representatives
At the top of each state page (both unemployment data and fun facts, is a PDF with links to the governors, U. S. Senators and U.S. House Representative web page along with their phone numbers. Please let them know how you feel about the job they are doing.
Please share.
Office of Federal Contract Compliance Programs (OFCCP) New Regulations: Section 503 of the Rehabilitation Act
OFCCP’s New Regulations to Improve Job Opportunities for Individuals with Disabilities
Unemployed by Duration

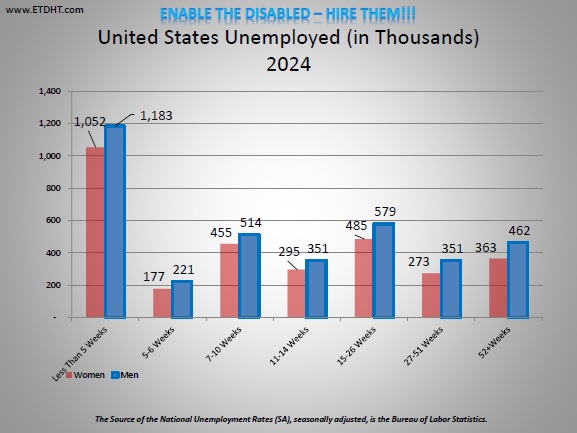
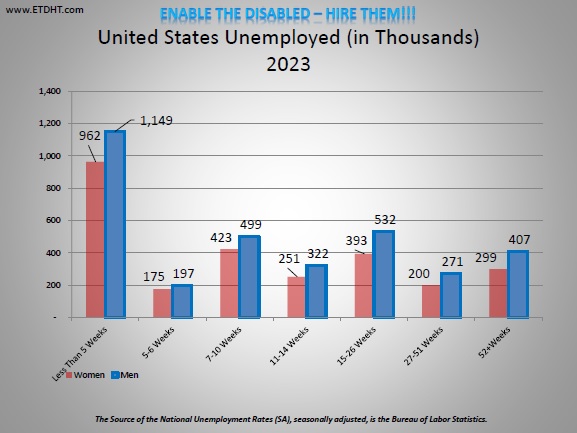
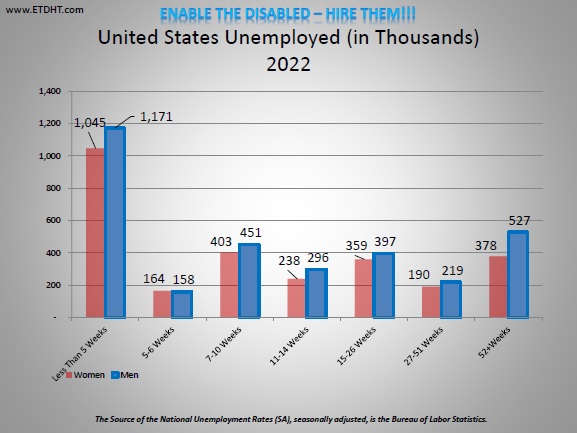
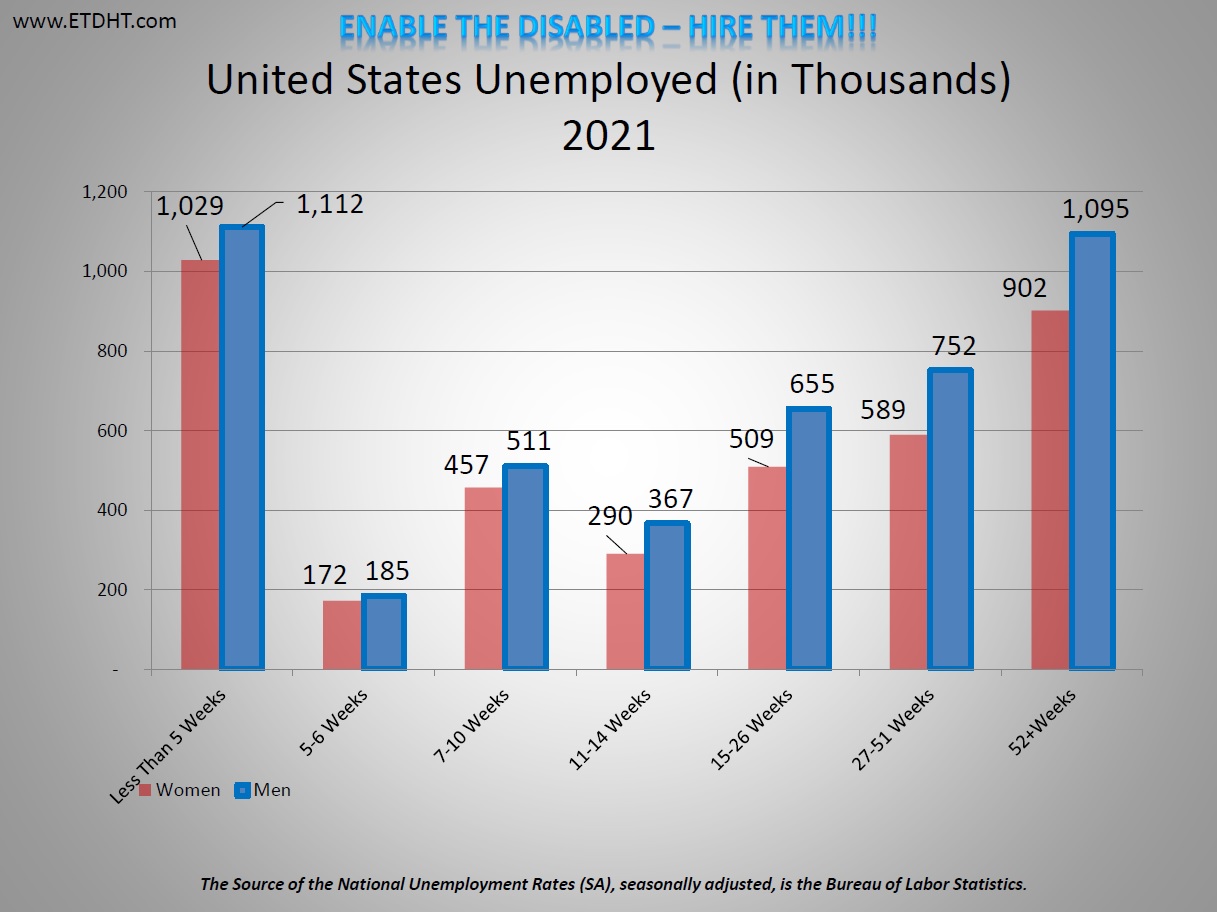


PLEASE NOTE: The Number of People Unemployed Over 52 Weeks is initially based on an estimate when the national data comes out each month but is more accurately represented when the state data is available. The percentages, however, will not change.